भारत ने पहले टी20 में श्रीलंका को 38 रन से दी मात… सूर्य के बाद भुवी ने बिखेरी चमक…
नई दिल्ली. भारतीय टीम ने सूर्यकुमार यादव (Suryakumar Yadav) के शानदार अर्धशतक के बाद पेसर भुवनेश्वर कुमार (Bhuvneshwar Kumar) की कमाल की गेंदबाजी की बदौलत सीरीज के पहले टी20 अंतरराष्ट्रीय मुकाबले में श्रीलंका को 38 रन से हरा दिया. इस जीत के साथ शिखर धवन (Shikhar Dhawan) की कप्तानी वाली टीम ने तीन मैचों की सीरीज में 1-0 की बढ़त भी बना ली. कोलंबो के आर. प्रेमदासा स्टेडियम में रविवार को खेले गए मुकाबले में भारत ने 20 ओवर में 5 विकेट पर 164 रन बनाए. लक्ष्य का पीछा करते हुए मेजबान टीम की पारी 18.3 ओवर में 126 रन पर ही सिमट गई.
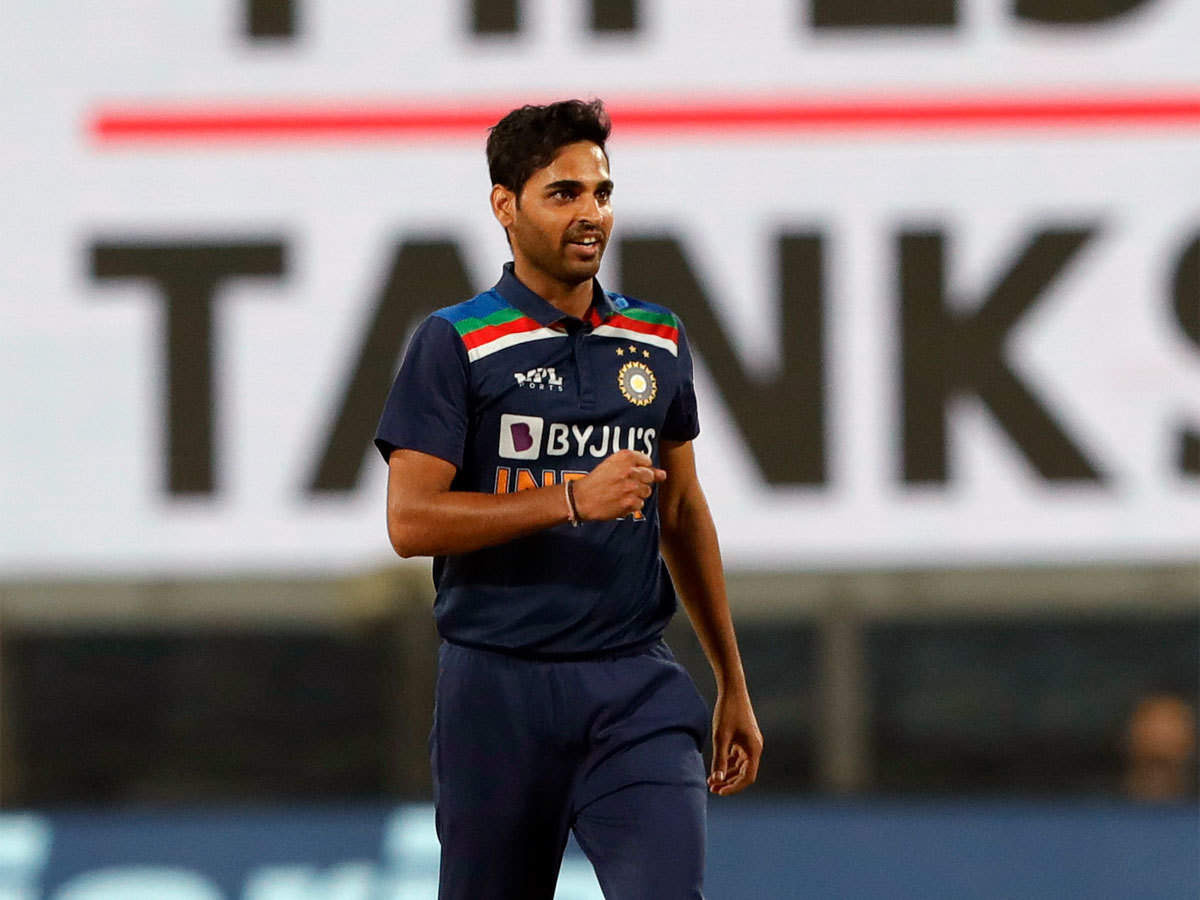
श्रीलंका के कप्तान दासुन शनाका ने टॉस जीता और भारत को पहले बल्लेबाजी का न्योता दिया. भारत ने श्रीलंका को 165 रन का लक्ष्य दिया जिसका पीछा करते हुए श्रीलंका की टीम तेज गेंदबाजों भुवनेश्वर (22 रन पर 4 विकेट) और दीपक चाहर (24 रन पर 2 विकेट) की धारदार गेंदबाजी के सामने कुछ खास नहीं कर सकी. मेजबान टीम ने अपने अंतिम सात विकेट सिर्फ 36 रन पर गंवाए. मेजबान टीम की ओर से चरिथ असालांका ने सर्वाधिक 44 रन बनाए.
स्पिनर युजवेंद्र चहल ने भी किफायती गेंदबाजी करते हुए 19 रन देकर एक विकेट हासिल किया जबकि डेब्यू कर रहे वरुण चक्रवर्ती ने एक विकेट लिया. ऑलराउंडर हार्दिक पंड्या और उनके भाई क्रुणाल पंड्या ने भी एक-एक विकेट चटकाया. दुष्मांता चमीरा (24 रन पर दो विकेट) और वानिंदु हसारंगा (28 रन पर दो विकेट) की उम्दा गेंदबाजी के सामने भारत भी सूर्यकुमार (50) के अर्धशतक और कप्तान शिखर धवन (46) की उपयोगी पारियों के बावजूद पांच विकेट पर 164 रन ही बना सका था.
सूर्यकुमार ने 34 गेंद की अपनी पारी में पांच चौके और दो छक्के जड़े. उन्होंने धवन के साथ तीसरे विकेट के लिए 62 रन की साझेदारी भी की. धवन ने संजू सैमसन (27) के साथ दूसरे विकेट के लिए 51 रन जोड़े. आर प्रेमदासा स्टेडियम में ही 27 जुलाई को दूसरा टी20 मुकाबला खेला जाएगा.
श्रीलंका की शुरुआत भी अच्छी नहीं रही. चाहर की गेंद पर मिनोद भानुका को हार्दिक ने जीवनदान दिया. यह सलामी बल्लेबाज हालांकि क्रुणाल की गेंद पर कवर में सूर्यकुमार को कैच दे बैठा. उन्होंने 10 रन बनाए. सलामी बल्लेबाज अविष्का फर्नांडो ने चाहर पर दो चौके जड़े जबकि धनंजय डी सिल्वा ने भी क्रुणाल पर चौका मारा. श्रीलंका ने पावर प्ले में एक विकेट पर 44 रन बनाए.


