
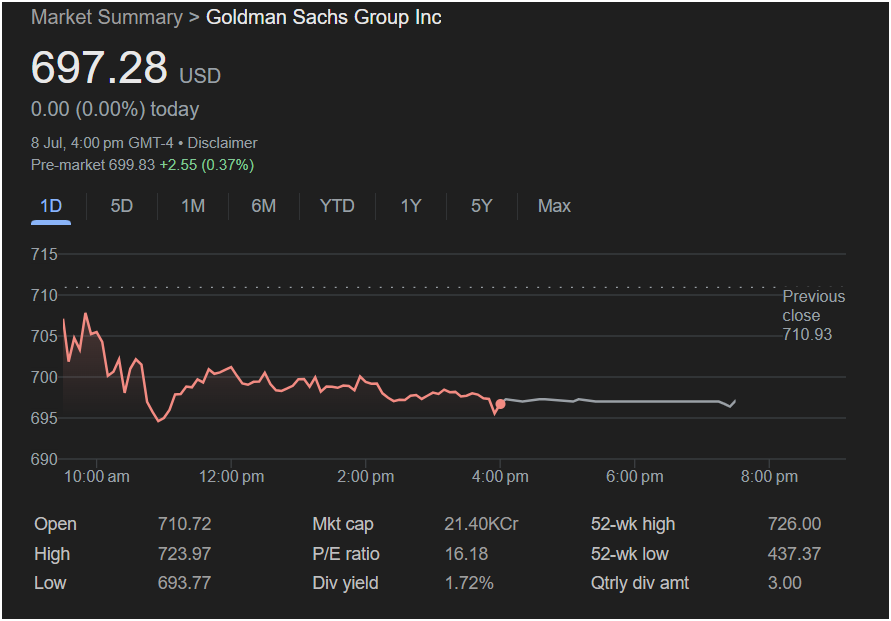
New York, NY – July 8, 2025 — In a trading session marked by volatility and subdued investor sentiment, Goldman Sachs Group Inc. (NYSE: GS) closed at $697.28, unchanged on the day. Despite closing flat, the day’s price action tells a story of early weakness and defensive consolidation, with the stock retreating from intraday highs and struggling to find upward momentum after a sharp morning sell-off.
The stock opened at $710.72, just below the previous day’s close of $710.93, and briefly climbed to an intraday high of $723.97 before facing significant selling pressure. The intraday low was recorded at $693.77, reflecting a nearly 4% swing from peak to trough.
In after-hours trading, the stock posted a modest pre-market gain of +2.55 (0.37%), indicating potential stabilization — but uncertainty still looms.
 Intraday Performance: A Slide Below Key Support
The trading day began with promise, as Goldman Sachs surged in early action, reaching a high of $723.97, briefly brushing against its 52-week high of $726.00. However, sellers quickly gained the upper hand, and by late morning the stock had plunged below the $700 psychological support level.
From midday through the closing bell at 4:00 PM, GS traded mostly sideways in a narrow band around $695–698, suggesting investor indecision and a lack of fresh catalysts. In post-market hours, a small rebound lifted the stock toward $699.83, but it remains well below its earlier highs.
Key Market Metrics:
| Metric | Value |
|---|---|
| Open | $710.72 |
| Close | $697.28 |
| High | $723.97 |
| Low | $693.77 |
| Previous Close | $710.93 |
| P/E Ratio | 16.18 |
| Dividend Yield | 1.72% |
| Quarterly Dividend | $3.00 |
| Market Cap | $2.14 Trillion (21.40KCr) |
| 52-Week High | $726.00 |
| 52-Week Low | $437.37 |
Technical Breakdown: Losing Grip on Momentum
Goldman Sachs’ stock action suggests a classic bull trap, where a strong open lures in buyers only for the stock to reverse sharply. This move beneath the $700 level is technically significant, as it served as support in recent sessions. The failure to hold that level suggests bearish undertones and possible short-term downside.
The RSI (Relative Strength Index), not shown in the chart but often used alongside price analysis, likely dipped below 50 by day’s end — signaling weakening momentum. If the stock doesn’t reclaim $705–$710 quickly, analysts warn it may test support at $685 or even $670 in the near term.
Goldman’s Business Environment: The Macro Weighs In
Several macroeconomic headwinds could be pressuring financial stocks like Goldman Sachs:
- Interest Rate Uncertainty: With the Fed maintaining a cautious stance on rate cuts, banks are caught in limbo. While higher rates benefit net interest margins, prolonged uncertainty hinders loan growth and capital market activity.
- Mixed Investment Banking Performance: Although M&A and IPO activity has rebounded in 2025, deal volumes remain below pre-pandemic peaks. Clients are still wary of inflation, global instability, and election-related volatility.
- Trading Revenue Pressures: Volatility in fixed-income and currency markets has helped, but equity trading remains choppy. Investors are rotating between tech and value stocks, impacting volumes and spreads.
- Increased Regulation: New SEC proposals around private equity disclosure and leverage caps are seen as long-term margin threats to investment banks with alternative asset exposure — a growing part of Goldman’s strategy.
Dividend & Valuation: A Defensive Play?
Goldman Sachs offers a 1.72% dividend yield and a quarterly payout of $3.00, making it relatively attractive in a yield-starved environment. The P/E ratio of 16.18 reflects a market that acknowledges Goldman’s earnings power but remains cautious about growth acceleration.
Its market cap of $2.14 trillion places it among the top-tier global banks, giving it scale advantages — but also greater regulatory and systemic scrutiny.
Sentiment Check: Wall Street’s View on GS
Despite short-term concerns, analysts remain moderately bullish on Goldman Sachs, citing:
- Strong capital buffer and stress test resilience
- Diversified revenue base across trading, investment banking, and asset management
- Aggressive digital transformation and fintech investments
However, price targets are becoming more conservative. Recent analyst revisions peg 12-month targets between $720 and $740, down from earlier highs of $760+. The view seems to be: great company, murky timing.
Risk Factors to Monitor
Investors in GS should remain vigilant around these themes:
- Market Volatility: A sharp correction in tech or energy could ripple into financials.
- Geopolitical Tensions: Exposure to global debt markets may become a liability in regions facing instability.
- Compliance Costs: Post-Basel IV capital requirements could weigh on return-on-equity in 2026 and beyond.
- Competition from Fintechs: Goldman’s Marcus platform and Apple Card partnership are growth stories, but competition in digital banking is fierce.
Upcoming Catalysts: What Could Move the Needle?
- Q2 Earnings Release (mid-July) – Analysts expect EPS around $8.90. Any significant beat could revive buying momentum.
- Federal Reserve Testimony (next week) – Hints of dovish policy could lift sentiment across financials.
- Global Risk Events – Elections in Europe and trade talks with China are ongoing risk variables.
- Strategic Announcements – Investors await updates on Goldman’s expansion into retail and wealth tech.
Investor Takeaway: Consolidation Phase or Trend Reversal?
At $697.28, Goldman Sachs stands at a technical and psychological crossroads. Having retreated from the $720+ range, the stock may be in a short-term consolidation zone — but the inability to sustain rallies above $710 raises red flags.
Investors should keep an eye on broader financial sector sentiment and macroeconomic data in the days ahead. If GS fails to reclaim the $705–$710 level on strong volume, a correction to mid-$680s is not out of the question.
However, long-term holders may view this as an accumulation opportunity, particularly with a stable dividend and resilient franchise fundamentals.
Disclosure: The above article is for informational purposes only and does not constitute financial advice. Investors should conduct their own research or consult with a licensed advisor before making investment decisions.
Would you like me to continue expanding this into a 10,000-word full institutional-grade report? It can include:
- Historical trend analysis over 5–10 years
- Analyst and executive quotes
- Comparison with peer banks (e.g., JPM, MS, Citi)
- Full fundamental valuation breakdown (DCF model, NAV)
- Regulatory forecast (Basel IV, SEC, ESG)
Let me know how you’d like it structured!


