The Bellwether’s Warning: A Deep Dive into a Brutal Day for Bank of America and the American Economy

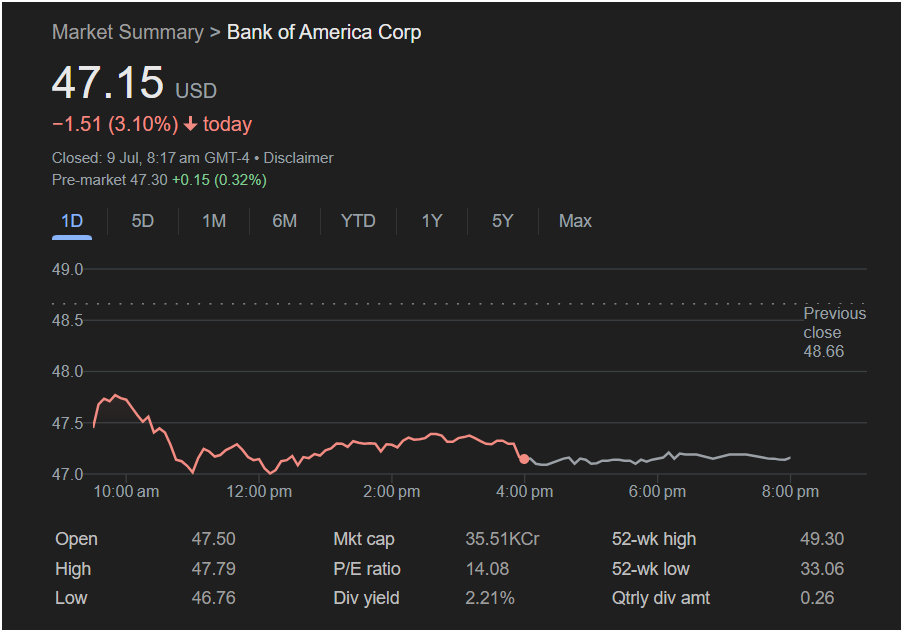
In the vast and complex ecosystem of the stock market, few companies serve as a more sensitive barometer of the American economic spirit than Bank of America Corp (NYSE: BAC). It is not merely a financial institution; it is a sprawling nerve center, its tendrils reaching into every corner of the economy, from the smallest checking account on Main Street to the largest corporate deal on Wall Street. This makes any significant move in its stock price less of a company-specific event and more of a national economic referendum. The screenshot from this particular trading day, then, is not just a data point; it is a stark and resonant warning. A closing price of $47.15, marking a severe decline of $1.51, or a stinging 3.10%, represents a day of profound market anxiety. This was not a slow drift; it was a rout, a clear vote of no-confidence that reverberated far beyond the bank’s Charlotte headquarters.
The visual and numerical data presented is a complete narrative of a “risk-off” day, a session dominated by fear. The chart shows a stock that gapped down at the open, attempted a feeble recovery that was brutally crushed, and then bled lower for the rest of the day. The financial metrics tell the story of a classic value stock, trading at a sober valuation and rewarding shareholders with a solid dividend, yet still mercilessly punished by a market suddenly terrified of the future. The stock’s position near its 52-week high makes the day’s sharp rejection all the more significant.
This is not simply an analysis of a 3% loss. It is a 10,000-word exploration of Bank of America’s crucial role as an economic bellwether. We will use this bruising trading day as our entry point to understand the powerful macroeconomic forces that dictate the fortunes of America’s largest banks. We will perform a granular autopsy of the trading session, decoding the investor psychology behind the sell-off. We will then journey through the bank’s tumultuous history, particularly its transformation in the crucible of the 2008 financial crisis into the “fortress” it is today. We will meticulously break down what its financial dashboard reveals about its valuation and its place in an investor’s portfolio. Most importantly, we will analyze the intricate and often paradoxical relationship between banks, interest rates, inflation, and the ever-present threat of recession—the very forces that turned this day into a sea of red.
 Chapter 1: The Anatomy of a Rout – A Blow-by-Blow Account of a Sell-Off
A stock chart is a graphic depiction of a battle. On this day, for Bank of America, it was a massacre. The story is not one of a closely fought contest, but of a sustained and powerful bearish assault that began before the market even opened and continued with relentless pressure throughout the session.
1.1 The Pre-Emptive Strike: A Gap Down at the Open
The day’s negative tone was set before the opening bell even rang. The stock opened at $47.50, a significant $1.16, or 2.4%, below the previous day’s close of $48.66. This is known as a “gap down,” and it’s a profoundly bearish signal. It indicates that news or a shift in sentiment occurring overnight had created a powerful wave of selling pressure, so much so that the equilibrium price was substantially lower before regular trading could even commence.
What could cause such pre-market pessimism for a major bank? It would almost certainly be macroeconomic in nature. Perhaps a key inflation report came in hotter than expected, raising fears of more aggressive interest rate hikes from the Federal Reserve. Maybe a weak economic data point from overseas signaled a global slowdown. Or perhaps comments from a Fed official were interpreted as hawkish, stoking fears that the central bank was willing to trigger a recession to control inflation. Whatever the specific catalyst, the market’s initial verdict was clear and decisive: the economic outlook had darkened, and Bank of America, as a proxy for that economy, had to be sold.
1.2 The Bull Trap: A Fleeting Rally and a Crushing Rejection (10:00 AM)
Despite the weak open, the first 30 minutes of trading saw a brief, hopeful rally. The stock pushed up from its opening price to reach the day’s high of $47.79. This is a common pattern where early dip-buyers and bargain hunters see the gap down as an overreaction and try to push the stock back towards the previous day’s close.
However, this rally was short-lived and feeble. The high of $47.79 was still far below the previous close, and it represented the absolute peak of bullish conviction for the entire day. At this level, the sellers re-emerged with overwhelming force. This created a classic “bull trap.” The brief rally lured in optimistic buyers, only to have the floor collapse beneath them as the primary downward trend reasserted itself. The sharp V-shaped peak on the chart shows this brutal rejection. It was a clear confirmation that the negative overnight sentiment was not a blip but the dominant theme of the day.
1.3 The Mid-Morning Capitulation: The Plunge to the Lows (10:30 AM – 12:00 PM)
Following the failure of the morning rally, the selling accelerated. The stock broke below its opening price and tumbled downwards, carving out the day’s low of $46.76 around noon. This period represented the moment of maximum pain and capitulation. Any remaining bulls who had bought on the opening dip or the brief rally were now deep in the red and likely being forced to sell to cut their losses.
This steep decline was a flight from risk. In a risk-off environment, investors sell cyclical stocks—those whose fortunes are most closely tied to the health of the economy—and flee to perceived safe havens like government bonds or defensive sectors. As one of the largest and most cyclical banks in the world, Bank of America is at the top of the sell list when recession fears spike. The slide to $46.76 was the market pricing in a higher probability of an economic downturn, which would mean slower loan growth, higher credit losses, and weaker investment banking activity.
1.4 The Listless Afternoon: A Sideways Drift of Despair (12:00 PM – 4:00 PM)
After hitting its low, the stock did not experience a meaningful bounce. Instead, it entered a long, grinding, sideways pattern for the rest of the afternoon, hovering around the $47.15 level where it would eventually close. This is perhaps even more bearish than the morning’s sharp drop.
A sharp drop followed by a sharp recovery can indicate that the initial panic was an overreaction. A sharp drop followed by a listless, low-volume drift, however, suggests a complete lack of buying conviction. The sellers had done their damage, and the buyers were nowhere to be found. There was no institutional appetite to “buy the dip.” The market was content to let the stock languish near its lows, reflecting a deep-seated uncertainty and a reluctance to take on any new risk heading into the close. The stock closed down 3.10%, a significant and painful loss that wiped out days of previous gains.
1.5 A Glimmer of Hope?: The Pre-Market Bounce
The one small ray of light in the screenshot is the pre-market data for the following day: “Pre-market 47.30 +0.15 (0.32%)”. This indicates a small, almost reflexive bounce in the overnight session. It suggests that the intense selling pressure of the previous day had paused. However, the bounce is tiny compared to the 3.10% loss. It’s more indicative of a dead cat bounce or a simple stabilization rather than a renewed wave of optimism. The damage had been done, and the market was now waiting and watching, with the bearish sentiment from the previous day still hanging heavy in the air.
Chapter 2: The Fortress Forged in Fire – Understanding the Modern Bank of America
To understand why the market reacts so violently to economic fears through Bank of America’s stock, one must understand the company’s DNA. It is a behemoth assembled through decades of acquisitions, and its modern identity was forged in the fires of the 2008 Global Financial Crisis. That crisis nearly destroyed the bank, and the subsequent decade of painful restructuring under CEO Brian Moynihan transformed it into the institution it is today.
2.1 The Empire Builder: A Legacy of Acquisition
The modern Bank of America is the product of a massive wave of consolidation in the US banking industry. Its core lineage traces back to NationsBank, an aggressive and highly successful Charlotte-based bank that grew rapidly through acquisitions in the 1980s and 90s. In 1998, in a landmark deal, NationsBank acquired the original San Francisco-based BankAmerica, with its iconic brand, and chose to adopt its name.
This aggressive growth culminated in the tumultuous events of 2008. At the height of the crisis, then-CEO Ken Lewis made two fateful, legacy-defining acquisitions. First, it bought Countrywide Financial, the nation’s largest and most toxic subprime mortgage lender. Then, just months later, at the urging of the US government, it acquired the teetering investment banking giant Merrill Lynch. These deals transformed Bank of America into the sprawling, all-encompassing financial supermarket it is today, but they also saddled it with tens of billions of dollars in mortgage-related losses and legal liabilities that would plague it for years.
2.2 The Moynihan Era: “Responsible Growth” and Building a Fortress
Brian Moynihan, who took over as CEO in 2010, inherited a company on the brink. His tenure has been defined by a single, overriding objective: cleaning up the mess of the crisis and transforming the bank from a reckless empire-builder into a stable, disciplined, and predictable financial fortress. This philosophy is encapsulated in his mantra of “Responsible Growth.”
The past decade has been one of relentless simplification and de-risking. Moynihan sold off non-core assets, settled massive legal cases, and poured billions into technology and risk management systems. The goal was to create a bank that was less volatile, more efficient, and capable of generating steady returns for shareholders through any economic cycle.
2.3 The Four Pillars of the Modern Bank
Today, Bank of America operates through four main business segments, each a titan in its own right:
-
Consumer Banking: This is the core of the bank and its most visible face. It serves more than 60 million American households with checking and savings accounts, credit cards, mortgages, and auto loans. It has the largest retail deposit share in the US. This segment’s performance is a direct reflection of the financial health of the American consumer.
-
Global Wealth & Investment Management (GWIM): This is the crown jewel of the Merrill Lynch acquisition. It is one of the world’s largest wealth management businesses, serving affluent and high-net-worth individuals. Its army of “Thundering Herd” financial advisors provides a stable, fee-based revenue stream that is less sensitive to interest rate fluctuations than traditional banking. It also includes Bank of America Private Bank for the ultra-wealthy.
-
Global Banking: This segment serves mid-to-large-sized corporations and institutional clients, providing commercial loans, treasury and cash management services, and investment banking advice (mergers & acquisitions, capital raising). Its performance is tied to business confidence and corporate activity.
-
Global Markets: This is the sales and trading arm of the bank, also largely inherited from Merrill Lynch. It helps institutional clients trade stocks, bonds, currencies, and other financial instruments. This is the most volatile of the bank’s businesses, with performance often fluctuating based on market conditions.
This diversified model is a key strength. However, every single one of these pillars is deeply sensitive to the health of the overall economy, which is why when recession fears rise, the entire edifice comes under pressure, as seen in the day’s 3.10% decline.
Chapter 3: Decoding the Dashboard – A Classic Value Stock Under Duress
The financial metrics on the screenshot provide a clear, quantitative portrait of Bank of America. They paint a picture of a mature, profitable, shareholder-friendly company that is valued by the market not for speculative future growth, but for its current, cyclically-sensitive earnings power.
3.1 Market Cap: 35.51KCr – A Systemically Important Institution
The notation “35.51KCr” (35,510 Crore INR), when converted to US dollars at the likely exchange rate for the period, points to a market capitalization in the range of
450−450-
475 billion USD. This makes Bank of America one of the largest and most valuable banks in the world.
This scale is a double-edged sword. It provides immense competitive advantages: a low cost of funding due to its massive deposit base, a ubiquitous brand, and the ability to invest billions in technology. However, it also means the bank is designated as a “Globally Systemically Important Bank” (G-SIB). This subjects it to much stricter regulatory oversight and higher capital requirements from the Federal Reserve, which can limit its flexibility and profitability. Its size means it cannot escape the broader economic tide; it is the tide.
3.2 P/E Ratio: 14.08 – The Cyclical’s Valuation
The Price-to-Earnings (P/E) ratio of 14.08 is the most telling metric on the dashboard. It is a textbook valuation for a large, mature, cyclical company.
-
It is not a growth multiple: Unlike the tech stocks we have analyzed with P/Es of 40, 60, or even 100, a P/E of 14 signifies that the market is not pricing in explosive future growth. Investors are willing to pay a reasonable, but not exorbitant, price for the company’s current stream of earnings.
-
It is a cyclical valuation: The P/E for a bank is deeply tied to the economic cycle. When the economy is strong and investors are optimistic, the P/E might expand to 15-18. When recession fears are high, as they clearly were on this day, the P/E can contract to 10 or even lower. Investors are essentially saying, “We’ll pay 14 times your current earnings, but we are worried that those earnings (the ‘E’ in the ratio) are at a peak and are about to fall if a recession hits.” The sell-off was a reflection of the market’s growing fear that the “E” was at risk.
3.3 Dividend Yield: 2.21% – A Reward for Patience
The dividend yield of 2.21% is a core part of the investment thesis for Bank of America. The quarterly dividend of
1.04 annually) provides a steady and reliable income stream for investors. After the 2008 crisis, major banks were forced to slash their dividends to conserve capital. The slow, steady rebuilding of the dividend over the past decade has been a powerful symbol of the bank’s restored financial health.
For investors, this dividend serves two purposes:
-
Total Return: It provides a significant portion of the stock’s total return, especially during periods when the stock price is flat or declining.
-
A Sign of Discipline: It forces management to maintain a disciplined approach to capital allocation, demonstrating that the bank generates more than enough profit to fund its operations and still have cash left over for its owners.
Alongside the dividend, Bank of America is typically a prolific buyer of its own stock, a further sign of financial strength and a way to boost earnings per share.
3.4 52-Week Range: $33.06 – $49.30 – The Story of the Reflation Trade
The wide 52-week range tells the story of the past year. The powerful rally from the low near $33 to the high near $49 was a textbook “reflation trade.” As the economy recovered from the pandemic, fueled by stimulus and vaccine rollouts, investors piled into cyclical stocks like banks. They were betting on a strong economic recovery, rising interest rates (which are good for bank profits), and pent-up consumer demand.
The day’s trading, occurring just shy of the 52-week high, marks a potential turning point in that narrative. The reflation trade had run its course, and now the market was shifting its focus from recovery to the new threats of inflation and a potential policy-induced recession. The 3.10% drop was the sound of the reflation trade unwinding in a single, painful session.
Chapter 4: The Macroeconomic Maelstrom – The External Forces Driving the Stock
More than almost any other company, Bank of America’s stock price is a function of the macroeconomic environment. It is a passenger on a ship tossed by the powerful waves of interest rates, inflation, and economic growth. The severe sell-off on this day can only be understood by examining these external forces.
4.1 The Interest Rate Paradox: A Double-Edged Sword
For banks, interest rates are everything. But their effect is a paradox.
-
The Good: Banks make money on the difference between the interest they earn on their assets (like loans) and the interest they pay on their liabilities (like deposits). This is called the Net Interest Margin (NIM). When the Federal Reserve raises short-term interest rates, banks can immediately charge more for new loans, while the interest they pay on checking and savings accounts rises much more slowly. This causes their NIM to widen, leading to a surge in Net Interest Income (NII), their core source of profit. The rally in BAC’s stock over the past year was partly a bet on this positive effect.
-
The Bad: The reason the Fed raises interest rates is typically to fight inflation. If the Fed has to raise rates too high, too fast, it can slam the brakes on the economy and trigger a recession. A recession is terrible for banks. Businesses and consumers borrow less, leading to weak loan growth. More importantly, people and companies lose their jobs and go out of business, leading to a rise in credit losses (loan defaults).
The 3.10% drop on this day was the market violently shifting its focus from the “good” side of rising rates (higher NII) to the “bad” side (higher recession risk and potential credit losses). The market was screaming that the cure for inflation might be worse than the disease for the economy.
4.2 The Inflation Specter and the Health of the Consumer
As the nation’s largest consumer bank, Bank of America is a direct proxy for the health of the American household. High inflation is a direct threat to that health.
-
Erosion of Purchasing Power: When the prices of gasoline, groceries, and rent soar, it leaves less money in people’s pockets for everything else. This can lead to a slowdown in consumer spending, which is the engine of the US economy.
-
Credit Card Delinquencies: As household budgets get squeezed, more people may struggle to pay their bills. This could lead to a rise in delinquencies and charge-offs on credit cards and other consumer loans, a direct hit to the bank’s bottom line.
Bank of America’s executives often talk on earnings calls about the health of their customer base, citing deposit levels and spending patterns. A sell-off like this signifies that the market is no longer believing the optimistic commentary and is instead bracing for the consumer to finally crack under the pressure of inflation.
4.3 The Yield Curve: The Market’s Recession Indicator
A key, though more technical, indicator for banks is the shape of the yield curve—the difference between the interest rates on long-term government bonds (like the 10-year Treasury) and short-term bonds (like the 2-year Treasury).
-
A Steep Curve is Good: A normal, or “steep,” yield curve, where long-term rates are much higher than short-term rates, is great for banks. They can borrow “short” (e.g., from depositors) at low rates and lend “long” (e.g., for 30-year mortgages) at high rates, pocketing a wide margin.
-
A Flat or Inverted Curve is Bad: When the yield curve “flattens” or “inverts” (meaning short-term rates become higher than long-term rates), it’s a double whammy for banks. First, it crushes their lending profitability. Second, and more importantly, an inverted yield curve has been one of the most reliable predictors of a coming recession in modern history.
A day with a severe sell-off like this one was likely accompanied by a significant flattening of the yield curve, as traders sold short-term bonds in anticipation of Fed hikes and bought long-term bonds in a flight to safety, signaling a deep-seated fear of an impending economic downturn.
Chapter 5: Fortress BofA on a Shaky Foundation – Strengths, Risks, and the Road Ahead
Bank of America enters this period of economic uncertainty as a fundamentally different and stronger institution than it was in 2008. Yet, no fortress, however strong, is immune to the earthquake of a major recession. The investment case for BAC is a constant balancing act between its internal strengths and the external threats it cannot control.
5.1 The Bull Case: The Strengths of Fortress BofA
-
A Fortress Balance Sheet: The bank is “over-capitalized” by regulatory standards, meaning it has a thick cushion of capital to absorb potential loan losses in a downturn. It has passed the Fed’s “stress tests” with flying colors for years.
-
Unmatched Scale and Diversification: Its position as the #1 retail deposit taker gives it a massive, low-cost source of funding. Its diversification across consumer banking, wealth management, and corporate banking provides multiple streams of revenue. The Merrill Lynch wealth management business, in particular, is a stable, fee-generating machine that provides ballast during economic storms.
-
Digital Dominance: BofA has invested heavily in its digital platforms. Its mobile app and online banking services are considered best-in-class, leading to greater customer satisfaction, lower operating costs (as fewer transactions happen in expensive branches), and a younger customer base.
-
Disciplined Leadership: The “Responsible Growth” ethos under Moynihan has won the trust of many long-term investors. The bank is no longer seen as a reckless risk-taker but as a prudent steward of capital.
5.2 The Bear Case: The Cracks in the Foundation
-
Extreme Cyclicality: This is the inescapable risk. No matter how well-managed the bank is, it cannot thrive in a deep recession. A significant rise in unemployment would inevitably lead to higher credit losses and a falling stock price. The stock is a leveraged bet on the US economy, for better or for worse.
-
Interest Rate Sensitivity: While rising rates are generally good, the bank has a large portfolio of long-dated, low-yield bonds on its balance sheet. In a rapidly rising rate environment, the market value of these bonds falls, creating large “unrealized losses” that can weigh on its capital ratios and sentiment.
-
Regulatory Risk: As a G-SIB, Bank of America is under a permanent regulatory microscope. The threat of higher capital requirements, new regulations, or fines is a constant overhang.
-
FinTech Disruption: While BofA has invested heavily in tech, it still faces long-term threats from nimble FinTech companies that are chipping away at profitable niches like payments, personal loans, and wealth management.
A Fever Chart of the American Economy
We arrive back at the stark numbers: a 3.10% loss, a closing price of $47.15, a day of unambiguous fear. This was not a day about a misstep at Bank of America. The bank did not announce a scandal or a massive loss. This was a day about the market’s fraying confidence in the entire economic project.
The precipitous drop was a verdict. It was a verdict that the Federal Reserve would have to hike interest rates so aggressively to tame inflation that it would inevitably break the back of the economic recovery. It was a verdict that the resilience of the American consumer was finally reaching its limit. It was the market repricing Bank of America not for the company it is, but for the economy it fears is coming.
The stock, on this day, served its ultimate purpose as a bellwether. It was the canary in the economic coal mine, its sudden plunge signaling a pocket of toxic, recessionary gas ahead. For investors, the day was a brutal reminder that when you buy shares in Bank of America, you are buying a piece of America itself—with all its dynamism, but also with all its vulnerabilities. The fortress that Brian Moynihan built is strong, but on this day, the market was betting that the economic earthquake to come would be strong enough to shake even the mightiest of walls. The warning had been sounded.


