T-Mobile Stumbles in Volatile Session, Ominous Pre-Market Plunge Signals Further Pain Ahead for Telecom Giant

BELLEVUE, WA – Shares of T-Mobile US Inc. (NASDAQ: TMUS), the telecommunications disruptor that has reshaped the American wireless landscape, endured a volatile and ultimately negative trading session on Tuesday, July 9th. The day was marked by sharp swings, reflecting a fierce battle between buyers and sellers. However, the real story emerged after the closing bell, with a dramatic pre-market decline pointing to significant headwinds and investor anxiety brewing for the “Un-carrier.”
By the end of regular trading, T-Mobile stock closed at
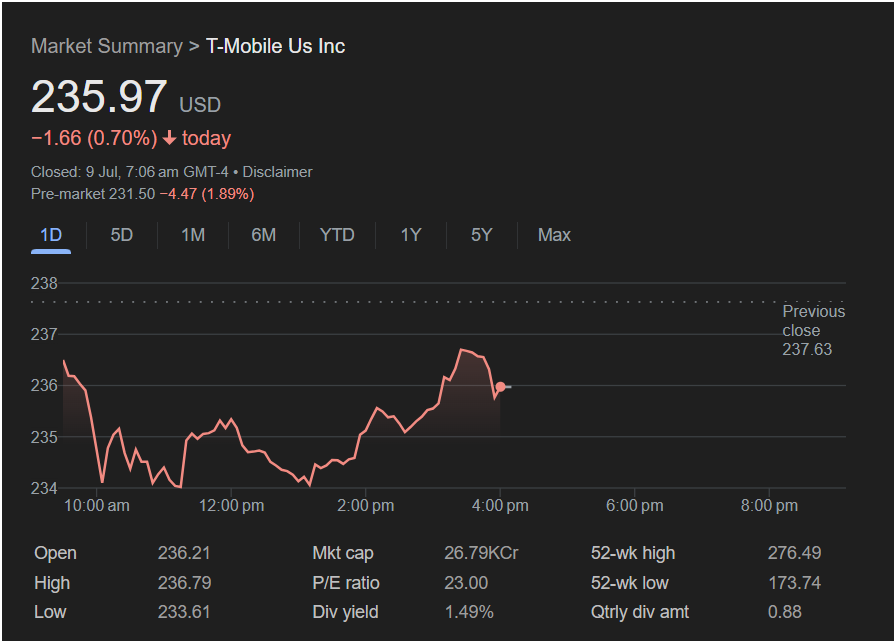
1.66, translating to a 0.70% decline. But the more alarming figure came from the pre-market data captured at 7:06 AM GMT-4. In early trading for the following day, the stock was already indicating a steep drop to
4.47 or 1.89%. This ominous signal suggests that a negative catalyst—be it company-specific news, an analyst downgrade, or broader sector concerns—had emerged after hours, setting the stage for a potentially bruising follow-up session.
The day’s performance and the subsequent pre-market activity provide a compelling snapshot of a company at a crossroads, balancing its market-leading growth against the intense pressures of a mature and highly competitive industry. This article will provide a forensic analysis of the July 9th trading session, contextualize the stock’s position within its fundamental and historical framework, and explore the deep-seated dynamics that define T-Mobile’s role in the American economy.
Part I: The Anatomy of a Volatile Day – A Narrative of Struggle and a Looming Storm
The one-day (1D) chart for T-Mobile is a dramatic “W-shaped” pattern, a visual representation of a market struggling for direction before succumbing to negative pressure that intensified after hours.
The Morning Plunge and the Establishment of a Low (10:00 AM to 11:00 AM)
The trading day began on a decidedly negative note. Coming off a previous close of $237.63, T-Mobile opened significantly lower at $236.21. This “gap down” opening immediately signaled that bearish sentiment was in control from the outset.
This initial weakness intensified in the first hour of trading. Sellers pushed the stock down aggressively, carving out the day’s absolute low of $233.61. This sharp morning decline could be attributed to a number of factors, including broader market weakness, negative sentiment towards the communications sector, or institutional selling pressure. This early plunge established a critical support level that would be tested and defended throughout the day.
The Midday “Un-carrier” Rally: A Fight for Recovery (11:00 AM to 3:30 PM)
Just as it seemed the stock was destined for a straight-line decline, buyers emerged with force. The $233.61 level proved to be a line in the sand, and from this nadir, a powerful recovery rally began. This ascent formed the middle section of the day’s “W” pattern.
The rally was not a smooth one; it was choppy and hard-fought, with several small pullbacks along the way. However, the prevailing trend was upwards. The stock methodically climbed back through the $234 and $235 levels, completely erasing the morning’s deep losses. This strong buying response demonstrated that a contingent of investors viewed the morning’s price as an attractive entry point, reaffirming their belief in the company’s value.
This bullish momentum culminated in the mid-afternoon, around 3:30 PM, when the stock reached its session high of $236.79. This peak represented a remarkable recovery of over $3 from the morning’s low.
The Late-Day Rejection and Weak Close (3:30 PM to 4:00 PM)
The afternoon peak at $236.79 was a critical moment. While it represented a strong rally, it failed to surpass the previous day’s close of $237.63. In technical analysis, a failure to reclaim a prior day’s close during an intraday rally is often seen as a sign of underlying weakness.
This failure proved to be the rally’s undoing. As the stock was rejected from this level, sellers re-emerged and pushed the price back down into the close. The stock gave up a significant portion of its afternoon gains in the final 30 minutes, ultimately closing at $235.97. This “fade into the close” left the stock with a 0.70% loss for the day, a disappointing finish after such a resilient midday fight.
The Closing Bell and the After-Hours Shockwave
The true drama, however, was revealed in the pre-market quote for the following day. The figure of $231.50—a drop of nearly 2% from the close—is a powerful and deeply bearish signal. A move of this magnitude outside of regular trading hours is almost always driven by a material news event. Potential catalysts could include:
-
A Negative News Announcement: The company may have released a press release after the market closed with disappointing news, such as a revision of its subscriber growth forecast or an announcement of an unexpected capital expenditure.
-
An Analyst Downgrade: A major Wall Street firm could have downgraded its rating on TMUS stock, triggering automated selling in the pre-market.
-
Negative Sector-Wide News: A competitor might have issued a profit warning, dragging the entire sector down with it.
This pre-market plunge completely changes the narrative. The volatile but contained loss of the regular session was suddenly dwarfed by a much more significant and ominous threat, suggesting that the bearish forces had found a powerful new reason to sell.
Part II: The Big Picture – Contextualizing the Telecom Behemoth
To fully grasp the significance of these movements, we must analyze the fundamental and historical data that underpins T-Mobile’s market presence.
Market Capitalization: A True Heavyweight
The provided Mkt cap of 26.79KCr translates to approximately $267.9 Billion USD. This valuation places T-Mobile among the largest telecommunications companies in the world. It’s a testament to its incredible growth story, fueled by its “Un-carrier” strategy and its transformative merger with Sprint. This massive scale makes it a core holding for many institutional investors and a key player in the critical infrastructure of the United States.
52-Week Perspective: A Pullback from a Strong Year
The stock’s 52-week high is $276.49, and its 52-week low is $173.74. The closing price of $235.97 is positioned firmly in the upper half of this range.
-
It is approximately $40.50 (or 14.6%) below its 52-week high.
-
It is a very substantial $62.23 (or 35.8%) above its 52-week low.
This context is vital. The stock has had a phenomenal year, rewarding long-term shareholders handsomely. However, it is currently in a correction phase, having pulled back significantly from its peak. The day’s trading, and especially the pre-market decline, suggest this corrective phase may have further to run. It’s a stock that is no longer in a state of pure momentum but is now in a period of consolidation and price discovery.
Valuation Analysis: The P/E Ratio of a Mature Disruptor
T-Mobile’s P/E ratio stands at 23.00. This is a very interesting and informative valuation.
-
It’s higher than a traditional value stock (like a utility or an old-line industrial company), reflecting the market’s expectation for continued growth in subscribers and free cash flow.
-
It’s significantly lower than a high-growth tech stock (like NVIDIA), acknowledging that T-Mobile operates in a mature, capital-intensive, and fiercely competitive industry with more limited top-line growth potential.
A P/E of 23 suggests a “Growth at a Reasonable Price” (GARP) profile. The market is willing to pay a premium over the general market average for T-Mobile’s best-in-class 5G network and its proven ability to steal market share. However, it is also tempering that optimism with the realities of the telecom sector. This valuation is a direct result of T-Mobile’s successful transition from a scrappy underdog to an established market leader.
Dividend Policy: The New Era of Capital Returns
The company’s Div yield is 1.49%, based on a Qtrly div amt of $0.88 (or $3.52 annually). This dividend is a relatively new and crucial part of the T-Mobile investment thesis. For years, as a high-growth disruptor, T-Mobile reinvested every dollar back into its business.
Following the successful integration of Sprint and the buildout of its 5G network, the company has transformed into a free-cash-flow machine. The initiation and growth of a dividend and a massive share buyback program signal a new era of maturity. T-Mobile is now signaling to the market that it can fund its network investments, compete aggressively, and return significant capital to its shareholders. This 1.49% yield provides a measure of support for the stock price and appeals to a broader class of investors than a pure-growth, no-dividend stock would.
Part III: The “Un-carrier” DNA and the 5G Advantage
T-Mobile’s journey is one of the most compelling business stories of the last decade, and its core identity continues to shape its market performance.
From Disruptor to Leader: T-Mobile’s “Un-carrier” campaign, launched over a decade ago under former CEO John Legere, fundamentally altered the US wireless industry. By eliminating two-year contracts, simplifying pricing, and offering customer-friendly perks, T-Mobile positioned itself as the antidote to the staid and unpopular models of AT&T and Verizon. This strategy won it millions of loyal customers and created a brand synonymous with disruption.
The Transformative Sprint Merger: The 2020 acquisition of Sprint was the company’s masterstroke. While costly and complex, it provided two critical assets:
-
Scale: It instantly vaulted T-Mobile’s subscriber base to be on par with its larger rivals.
-
Spectrum: Most importantly, it gave T-Mobile a treasure trove of mid-band 2.5 GHz spectrum. This specific type of spectrum is considered the “goldilocks” for 5G, offering a superior blend of wide coverage and fast speeds compared to the spectrum held by its competitors.
The 5G Moat: This mid-band spectrum advantage has allowed T-Mobile to build what is widely regarded as the nation’s leading 5G network. This network superiority is now its primary competitive moat and the engine for its future growth. It is leveraging this advantage to not only poach mobile customers from rivals but also to attack new markets.
Growth Beyond the Phone: T-Mobile’s future growth story is predicated on leveraging its 5G network. Two key initiatives are:
-
Fixed Wireless Access (FWA): Offering home and business internet service over its 5G network, directly competing with traditional cable and fiber providers. This has been a massive source of subscriber growth.
-
T-Mobile for Business: Making a concerted push into the enterprise and government sectors, an area historically dominated by AT&T and Verizon.
A Resilient Giant Facing a Sudden Storm
The trading session of July 9th was a microcosm of T-Mobile’s current reality: a company with the resilience to fight back from intraday lows, but one that is not immune to the powerful forces of a competitive market and negative news flow. The day’s 0.70% loss was a setback, but the truly significant event was the nearly 2% pre-market plunge that followed.
This after-hours drop signals that a new, negative variable has entered the equation, threatening to break the stock’s recent support levels and intensify its ongoing correction from its 52-week highs. Investors are now forced to weigh the company’s undeniable long-term strengths—its leading 5G network, its proven track record of growth, and its new commitment to shareholder returns—against a sudden and potent short-term threat.
The story of this single screenshot is therefore not just about a volatile day of trading. It is about the moment a market leader, a celebrated disruptor, was confronted with a new challenge that cast a shadow over its immediate future. The subsequent trading session will be critical in revealing the nature of this challenge and determining whether this is a fleeting storm or the beginning of a more prolonged period of turbulence for the Un-carrier.
Disclaimer: This article is an analysis of publicly available financial data from a specific point in time and is for informational purposes only. It does not constitute financial or investment advice. All investors should conduct their own research and consult with a qualified financial advisor before making any investment decisions.


