Bellwether Under Pressure: Visa’s Early Rally Evaporates in a Session of Fading Momentum, Raising Questions About Consumer Strength

SAN FRANCISCO, CA – In a trading day that began with a burst of bullish optimism but concluded with a whimper of bearish control, shares of the global payments technology giant Visa Inc. (NYSE: V) finished in negative territory, serving as a potential canary in the coal mine for the health of the global consumer. The stock, a critical component of the Dow Jones Industrial Average and a direct barometer of transactional commerce, closed the session at $354.55. This represented a decline of $2.09, or 0.59%, from the previous day’s close. While the percentage drop may appear modest, the intraday narrative—a sharp rally to a new high followed by a steady, grinding reversal—tells a more compelling story of investor anxiety and profit-taking in one of the market’s most reliable growth engines.
This in-depth analysis will meticulously dissect every data point presented in the July 9th market summary for Visa Inc. We will trace the stock’s volatile path from the opening bell to the after-hours session, interpreting the battle between buyers and sellers as it unfolded on the price chart. We will then conduct a thorough examination of the fundamental metrics that underpin Visa’s premium valuation, from its colossal market capitalization and high P/E ratio to its dividend policy, which balances growth with shareholder returns. By positioning this single day’s performance within the wider context of its 52-week trading range and its unique role as a tollbooth on the global economy, we aim to provide an exhaustive understanding of the forces at play and what this day’s trading might portend for investors, the financial sector, and the broader economy.
Part I: The Anatomy of a Trading Day – A Tale of a Bullish Start and a Bearish Fade
A stock chart is a graphic novel of market psychology, and on this day, the story for Visa was one of a failed breakout. It was a session defined not by a sudden shock, but by the slow, methodical erosion of initial strength, a pattern that often carries more weight for discerning investors than a single, sharp, news-driven move.
The Opening Bell: A Surge of Optimism
The market day began on a decidedly positive note for Visa. With a previous close of
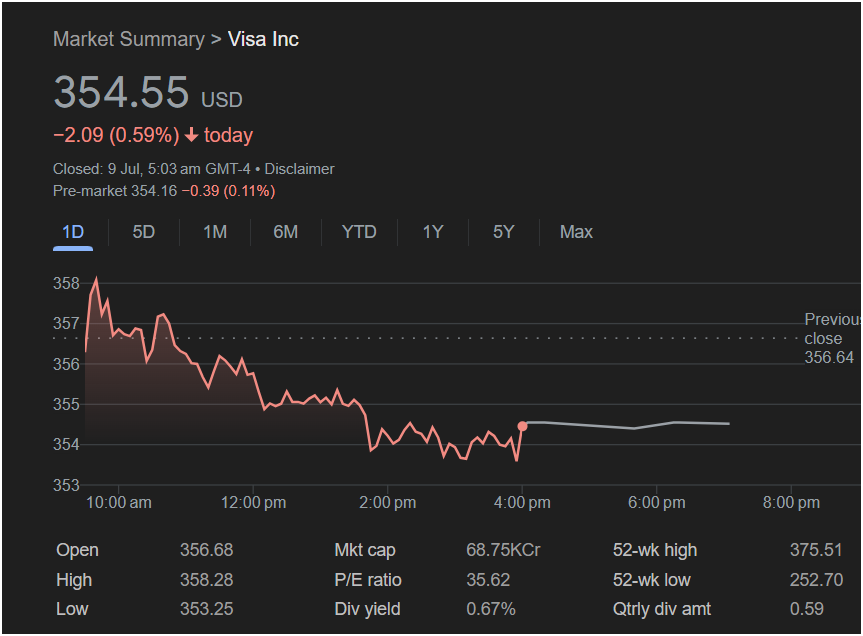
356.68, indicating a flat but stable handover from the prior session. However, this placid open was merely the launching pad for a powerful morning rally.
In the first hour of trading, a wave of buying pressure washed over the stock. This bullish conviction propelled the price upwards with significant momentum. The stock quickly cleared the
358.28**. This high point, reached relatively early in the session, represented a gain of nearly 0.5% from the open and showcased strong initial demand.
This morning rally can be attributed to several potential factors. It could have been driven by broad market strength, where a “risk-on” sentiment lifted all boats, particularly high-quality, large-cap leaders like Visa. Alternatively, there might have been a positive sector-specific catalyst, such as encouraging economic data related to retail sales or consumer confidence, which would directly benefit Visa’s business model. At this moment, it appeared that the bulls were firmly in command, ready to push the stock towards its 52-week high and beyond. The peak at $358.28 was the high-water mark of optimism for the day.
The Reversal: The Bears Take the Helm
The inability to sustain the rally above the $358 level proved to be the day’s critical inflection point. This level acted as a formidable wall of resistance, where the tide of buying was met and overwhelmed by a superior force of selling. From its peak, the stock began a steady and persistent decline that would define the remainder of the trading day.
The descent was not a panicked crash but a methodical grind lower, a pattern often described as a “slow bleed.” The stock price methodically broke down through the key psychological and technical levels it had just conquered: first $357, then the previous day’s close of $356.64, and then the $356 level. Each breach of a support level likely triggered more selling, as technical traders’ models turned bearish and stop-loss orders were hit.
This type of sustained selling pressure, following a failed morning rally, often indicates a fundamental shift in sentiment. It suggests that institutional investors—the large funds that move markets—may have been using the morning’s liquidity and strength as an opportunity to sell or reduce their positions. This “selling into strength” is a classic distribution pattern, where smart money unloads shares to an optimistic public before the trend reverses. The narrative had flipped from a bullish breakout to a bearish reversal.
The Afternoon Grind and the Day’s Low
The selling pressure continued unabated through the midday session, a period where trading volume typically lulls. The stock chart from noon to late afternoon shows a relentless, albeit choppy, path downwards. The small bounces were fleeting and were met with fresh waves of selling at lower and lower price points, a hallmark of a downtrend.
This culminated in the stock reaching its low for the day at $353.25. This nadir represented a significant intraday swing of $5.03 per share from the high of $358.28, a drop of about 1.4%. This level marked the point of maximum pessimism for the session, where the last of the hopeful bulls finally capitulated.
A Weak Close and Bearish After-Hours Sentiment
In the final hour of trading, the stock managed a very modest bounce off its lows, but the effort was feeble. It closed the session at **
353.25) than its high ($358.28). A weak close like this confirms that the bears were in control as the session ended, unable to be dislodged by any late-day bargain hunters.
The negative sentiment did not end at the 4:00 PM bell. The screenshot provides pre-market data for the following day, captured at 5:03 AM GMT-4. It shows the stock at
0.39 (0.11%) from the close. This indicates that the bearish pressure was continuing in the low-liquidity overnight session, suggesting the potential for a lower open and a continuation of the downtrend in the next trading day. The story of the day was clear: a promising start completely unwound by persistent, confident selling.
Part II: Deconstructing the Fundamentals – The Premium Price of a Flawless Business Model
Behind the daily price fluctuations lies the fundamental value of the company. Visa’s metrics reveal a corporate titan with a highly profitable business model that commands a premium valuation from the market. Understanding these numbers is key to understanding why the stock trades the way it does.
Market Capitalization: A Financial Supergiant
The screenshot displays Visa’s market capitalization as “68.75KCr,” a notation using the Indian numbering system. This likely corresponds to a value in Indian Rupees (68,750 Crore INR) or is a localized representation of the US dollar value. Given the stock price, the most plausible interpretation points to a US dollar market cap in the hundreds of billions. At the time of this trading day, Visa’s market capitalization was approximately $570 billion.
A market cap of this magnitude places Visa in the elite upper echelon of the world’s most valuable companies. It is a financial services behemoth whose value rivals the GDP of many developed nations. This valuation is a testament to:
-
Global Dominance: Visa’s payment network is one of the largest in the world, a critical piece of infrastructure for global commerce.
-
Scalability: Its business model is incredibly scalable. Once the network is built, each additional transaction costs very little to process, leading to enormous profit margins.
-
Brand Trust: The Visa brand is one of the most recognized and trusted financial brands globally, a significant competitive advantage.
The day’s decline of 0.59% might seem small, but for a company of this size, it translated into a loss of shareholder value of approximately $3.36 billion in a single session. This highlights the immense scale at which Visa operates and its significant influence on major market indices like the S&P 500 and the Dow Jones Industrial Average.
P/E Ratio: The Price of Growth at 35.62
Visa’s Price-to-Earnings (P/E) ratio is listed as a lofty 35.62. This means that investors were willing to pay $35.62 for every one dollar of Visa’s earnings over the past year. This is a premium valuation by any standard.
-
Context vs. the Market: Compared to the S&P 500’s historical average P/E of 15-20, Visa’s P/E is nearly double. This immediately classifies it as a “growth” stock, not a “value” stock.
-
Context vs. Financials: Traditional banks and insurance companies often trade at much lower P/E ratios (often in the 10-15 range) because their growth is more modest and their businesses are capital-intensive. Visa’s high P/E reflects its status as a technology company that operates within the financial sector, benefiting from high margins and secular growth trends.
-
Justifying the Premium: The market awards Visa this high multiple because of its exceptionally consistent and robust growth prospects. Investors are pricing in the continued global shift from cash and checks to digital payments, the growth of e-commerce, and the expansion of financial services in emerging markets. Visa is seen as a primary beneficiary of these powerful, long-term secular trends.
However, a high P/E ratio is a double-edged sword. It signifies immense confidence but also creates high expectations. The stock is priced for strong, uninterrupted growth. If Visa were to report earnings that missed expectations or issue guidance suggesting a slowdown in consumer spending, the stock could be severely punished as its high P/E multiple contracts. The day’s 0.59% decline can be seen as a minor tremor of this risk, where a slight increase in market anxiety led investors to question paying such a high premium for future growth.
The Dividend: A Nod to Shareholders
Visa’s dividend profile paints a picture of a company that is still firmly in its growth phase but is mature enough to return a portion of its immense profits to shareholders.
1. Dividend Yield: A Modest 0.67%
The dividend yield is a relatively low 0.67%. This is significantly below the S&P 500 average and is not high enough to attract pure income-seeking investors. This low yield is a direct consequence of Visa’s high stock price and its capital allocation strategy.
2. Quarterly Dividend Amount: A Consistent
0.59 per share. This translates to an annual dividend of **
0.59 x 4). We can confirm the yield calculation: ($2.36 annual dividend / $354.55 closing price) ≈ 0.67%.
The key takeaway from Visa’s dividend policy is that the dividend payment is secondary to its primary goal: reinvesting for growth. Visa’s management believes that the best use of its capital is to invest in its technology, expand its network, and make strategic acquisitions. In addition to this, Visa is known for its massive share buyback programs. By repurchasing its own shares, the company reduces the number of shares outstanding, which increases the earnings per share (EPS) and tends to support the stock price. For Visa, share buybacks are a far more significant method of returning capital to shareholders than dividends. The dividend is best viewed as a small, but consistently growing, bonus for holding a premier growth asset.
Part III: The Big Picture – A Toll Road on the Global Economy
To truly grasp the significance of Visa’s stock movements, one must understand its unique position in the world economy and its performance over the past year.
The 52-Week Range: A Pullback from a Position of Strength ($252.70 – $375.51)
The 52-week range for Visa is a low of
375.51. The closing price of $354.55 is situated firmly in the upper quartile of this range.
This context is vital. The day’s decline was not the sign of a stock breaking down, but rather a pullback after a period of incredible strength. To have traveled from a low of $252.70 to a high near $375 represents a massive rally of nearly 50% over the past year. Investors who bought at lower levels have seen substantial gains.
The current price of $354.55 is approximately 5.6% off its 52-week high. A pullback of 5-10% is considered perfectly normal and healthy for a stock in a strong uptrend. It allows the stock to consolidate its gains and shake out weaker hands before potentially making its next move higher. Therefore, while the intraday action was bearish, the long-term trend remains firmly positive.
The Business Model: The Ultimate “Toll Road”
The source of Visa’s strength and its premium valuation is its business model. Visa is not a bank. It does not issue credit or take on credit risk. Instead, it operates a massive, four-party payment network (connecting consumers, merchants, issuing banks, and acquiring banks).
For every transaction that rides on its “rails,” Visa takes a tiny percentage as a fee. It is, in effect, a digital toll road for global commerce. This model has several beautiful characteristics:
-
High Margins: Since the network is already built, the incremental cost of processing another transaction is minuscule, leading to phenomenal operating margins, often exceeding 60-70%.
-
Network Effect: The more consumers that use Visa, the more merchants want to accept it. The more merchants that accept it, the more valuable a Visa card becomes to consumers. This creates a powerful, self-reinforcing competitive moat that is almost impossible for newcomers to breach.
-
Inflation Hedge: Because Visa’s fees are typically a percentage of the transaction value, its revenues automatically increase with inflation as the price of goods and services rises.
Macroeconomic Bellwether: A Real-Time Gauge of Consumer Health
Because its revenues are directly tied to the volume and value of consumer and business transactions, Visa’s performance is one of the purest proxies for the health of the economy. When consumers are confident and spending freely, Visa’s transaction volumes soar. When a recession looms and consumers tighten their belts, it shows up almost immediately in Visa’s numbers.
This is why the day’s trading pattern is so noteworthy. The fade from the highs could be interpreted as the market’s “smart money” growing more concerned about a potential slowdown in consumer spending. With interest rates remaining elevated and inflation still a concern, the market may be signaling its belief that the consumer cannot remain resilient forever. A stock like Visa becomes a primary target for selling when these fears begin to surface.
Part IV: Looking Ahead – The Forces Shaping Visa’s Future
Visa’s future trajectory will be determined by its ability to capitalize on its immense strengths while navigating a landscape of growing risks.
The Bull Case: The Unstoppable Shift to Digital
Investors who remain bullish on Visa, and who might see the day’s dip as a buying opportunity, are focused on several powerful, long-term catalysts:
-
The War on Cash: The single biggest tailwind for Visa is the ongoing global transition from cash to digital forms of payment. In many parts of the world, cash is still the dominant form of payment, representing a massive runway for future growth.
-
E-commerce and Mobile Payments: The continued expansion of online shopping and the proliferation of mobile payment solutions all run on the payment rails provided by companies like Visa.
-
Cross-Border Transactions: As global travel and international commerce recover and grow, high-margin cross-border transactions will be a significant growth driver.
-
Value-Added Services: Visa is increasingly moving beyond simple transaction processing, offering sophisticated data analytics, fraud prevention, and consulting services to its banking clients, creating new, high-margin revenue streams.
The Bear Case: The Specter of Regulation and Disruption
Investors who are bearish on Visa, like the sellers who controlled the day’s trading, are wary of several significant threats:
-
Regulatory Risk: Visa and its main competitor, Mastercard, form a powerful duopoly. This has attracted intense scrutiny from regulators around the world who are concerned about their market power and the fees they charge. The risk of antitrust lawsuits or government-mandated caps on “swipe fees” is the single greatest threat to Visa’s business model.
-
Competition and Disruption: While its moat is strong, Visa faces competition from other card networks (Mastercard, American Express), as well as a new generation of FinTech innovators. “Buy Now, Pay Later” (BNPL) services, real-time payment networks being developed by central banks, and the theoretical threat of blockchain-based payment systems all aim to chip away at Visa’s dominance.
-
Economic Recession: A severe global recession would lead to a sharp contraction in consumer and business spending, which would directly and immediately impact Visa’s revenues and earnings, calling its premium valuation into question.
A Minor Dip in a Mighty Uptrend, But a Warning Shot Nonetheless
In the final analysis, the July 9th trading session for Visa Inc. was a textbook example of a bearish intraday reversal. The 0.59% decline was, on its own, unremarkable. But the journey—a strong morning rally that completely evaporated under the weight of persistent selling, followed by a weak close and a negative pre-market indication—was a clear victory for the bears on the day.
The fundamental data confirms Visa’s status as a best-in-class company with a near-flawless business model, deserving of its premium 35.62 P/E ratio. Its position in the upper echelon of its 52-week range underscores the powerful uptrend it has enjoyed.
However, the day’s trading served as a subtle but important warning shot. It highlighted the market’s underlying anxiety about the sustainability of consumer spending and the potential risks facing a stock priced for perfection. The session demonstrated that even a titan like Visa is not immune to shifts in sentiment. It was a day where the long-term secular growth story clashed with short-term macroeconomic fears, and for one session, the fears won. For investors, the day was a reminder that while Visa’s toll road on global commerce is wide and profitable, the traffic can, and will, slow down from time to time.