
A single day’s stock chart can be a fleeting snapshot, a momentary blip in a company’s long and storied journey. But sometimes, it can be a microcosm, a compressed narrative of the complex forces, investor sentiments, and market dynamics that define a corporate titan. On this particular day, Broadcom Inc. (NASDAQ: AVGO) presented just such a narrative. Closing at $271.80, the stock marked a decline of $2.38, or 0.87%, a seemingly modest move. Yet, peeling back the layers of this single trading session reveals a compelling story about a semiconductor behemoth grappling with sky-high valuations, immense market expectations, geopolitical headwinds, and the relentless hum of technological progress. This is not just the story of one day’s loss; it is an in-depth exploration of Broadcom’s very DNA, its position in the global economy, and the questions that will define its future, all seen through the lens of a 24-hour cycle of market activity.
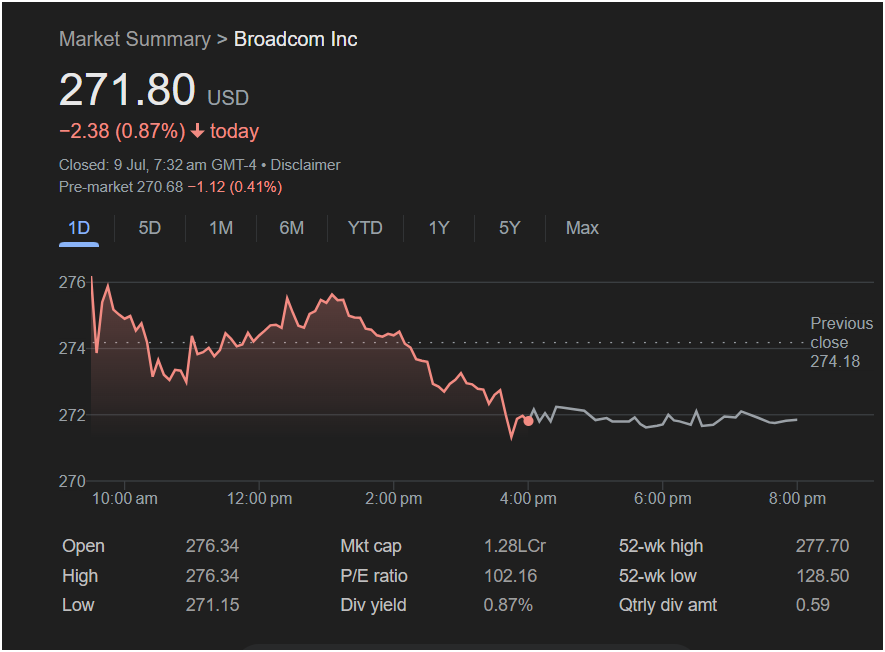
The provided data, captured in the early hours of July 9th, reflects the market’s final verdict on the preceding trading day. It was a day that began with promise, opening significantly higher than its previous close, only to see that optimism systematically eroded over the course of eight hours of trading. The journey from the day’s high of $276.34 to its low of $271.15 was a classic tale of sellers overpowering buyers, of initial enthusiasm giving way to a more sober assessment of risk. As the market closed and the digital dust settled, the red arrow pointing downward next to the closing price served as a stark, simple summary. But the numbers beneath the chart—the dizzying P/E ratio of 102.16, the vast 52-week range, the colossal market capitalization—hint at a much deeper, more intricate reality.
 This analysis will embark on a comprehensive journey, using this single day as our starting point and our guide. We will first perform a granular, minute-by-minute autopsy of the trading day itself, dissecting the investor psychology and potential catalysts behind the price action. From there, we will zoom out to understand the colossal entity that is Broadcom Inc., from its aggressive, acquisition-fueled history to its powerful position as a critical supplier to the world’s most influential technology companies. We will then dive headfirst into the financial metrics, decoding what they tell us about the company’s valuation, its commitment to shareholders, and the wild volatility it has experienced. Finally, we will place Broadcom within the broader context of the semiconductor industry’s super-cycle and the turbulent geopolitical and economic climate in which it operates. This is a 10,000-word exploration of a giant at the heart of our digital world, prompted by one day of decline.
Chapter 1: The Anatomy of a Decline – An Autopsy of a Trading Day
To truly understand the significance of the 0.87% drop, one must look beyond the final number and analyze the narrative woven by the price chart throughout the day. A stock chart is more than a line; it is a real-time record of a battle between hope and fear, greed and prudence, bulls and bears. The story of Broadcom’s day was one of a failed offensive by the bulls, followed by a successful and grinding counter-attack by the bears.
1.1 The Deceptive Dawn: A Gap-Up and an Immediate Reversal (10:00 AM)
The trading day for Broadcom did not begin with the weakness that would later define it. The stock opened at $276.34. This is a critical data point when compared to the “Previous close” of $274.18, indicated by the dotted line on the chart. The stock opened a full $2.16 higher than it had closed the previous day, a phenomenon known as a “gap up.” This suggests that events or sentiment shifts occurring after the previous day’s market close and before this day’s open had created a surge of buying interest.
What could cause such pre-market optimism? It could be any number of factors. Perhaps a positive analyst note was released, upgrading the stock or raising its price target. Maybe a piece of industry news suggested stronger-than-expected demand for 5G components or data center hardware, both core markets for Broadcom. It’s also possible that the broader market, reflected in index futures like the S&P 500 or NASDAQ 100, was pointing towards a strong open, lifting all boats, including Broadcom.
However, this optimism proved to be fleeting and fragile. The chart reveals that the opening price of $276.34 was also the high of the day. There was no follow-through. The stock hit this peak at the exact moment the opening bell rang and immediately began to fall. This is a profoundly bearish signal. It indicates the presence of “fade sellers”—investors who saw the gap-up not as a sign of fundamental strength, but as an opportunity to sell their shares at an artificially high price. They believed the pre-market enthusiasm was overblown and acted decisively to take profits or initiate short positions. The initial, sharp V-shape on the chart before 10:30 AM illustrates this tug-of-war: an initial surge of buying interest met by an even more powerful wave of selling pressure that quickly pushed the price back down towards, and then below, the previous day’s close.
1.2 The Morning Skirmish: A Battle for Control (10:30 AM – 12:00 PM)
The period following the initial sell-off was characterized by intense volatility. The chart displays a series of jagged peaks and troughs, oscillating roughly between $273 and $275. This was the market attempting to find a temporary equilibrium. The bulls, perhaps still believing in the morning’s optimistic premise, tried to defend key support levels. Each dip was met with some buying, pushing the price back up. The bears, emboldened by their success in fading the open, continued to apply pressure at every rally attempt.
This phase of the trading day is often dominated by high-frequency traders and day traders. They are not necessarily making long-term bets on Broadcom’s future, but rather capitalizing on short-term price movements. The jagged line represents thousands of individual decisions being made every second. A trader might buy at $273.50, hoping for a bounce to $274, while another might short at $274.50, betting it will fail to break higher. The volume of trading is typically highest during this morning session, and the price action reflects this frenetic activity. For Broadcom, the story of this morning skirmish was one of failure for the bulls. Despite several attempts to rally back towards the opening price, each peak was lower than the last, a classic technical sign of weakening momentum. The ceiling of resistance was lowering, while the floor of support was being tested repeatedly.
1.3 The Midday Doldrums: A Slow Grind Lower (12:00 PM – 2:30 PM)
As the market moved into the midday session, the frantic volatility of the morning often subsides. This period, sometimes referred to as the “lunchtime lull,” typically sees lower trading volumes as traders take a break and institutional investors await further catalysts. For Broadcom, this period was not a lull but a slow, grinding descent.
The chart line smooths out somewhat but maintains a clear and undeniable downward trajectory. The price drifts from around the $274 level down towards $273. This slow bleed is often more psychologically damaging for bullish investors than a sharp, quick drop. It suggests a persistent lack of buying interest. There are no significant rallies, no moments of hope—just a steady, methodical erosion of value. This can be caused by a lack of positive news flow to counteract the morning’s negative momentum. It can also reflect a broader market trend; if the major indices like the NASDAQ were also weakening during this period, it would create a headwind for even the strongest of stocks. The selling is less aggressive here, but it is constant and unopposed, slowly chipping away at the stock’s price.
1.4 The Afternoon Capitulation: The Final Plunge (2:30 PM – 4:00 PM)
The final 90 minutes of the trading day is often when institutional investors—the “smart money”—make their most significant moves. It is when the day’s narrative is often cemented. For Broadcom, this period was defined by capitulation.
Around 3:00 PM, the gradual decline steepened into a more pronounced drop. The stock broke decisively below the $273 level, which had offered some psychological support, and tumbled towards its ultimate low for the day at $271.15. This final leg down represents the point where the remaining bulls finally gave up. Those who had been holding on, hoping for an end-of-day rally, were forced to sell their positions to cut their losses, a process known as “stop-loss selling,” which can cascade and accelerate a decline.
What could trigger such a late-day plunge? It could be a specific news item hitting the wires—perhaps a negative report on a key Broadcom customer like Apple, or a rumor of new trade restrictions. More likely, it was the culmination of the day’s negative sentiment. As the close approached, it became clear that no rescue rally was coming. The stock was going to close weak, and investors did not want to hold a losing position overnight, especially with pre-market data already suggesting further weakness for the following day. The close at $271.80 was a modest bounce off the absolute low but was a clear victory for the bears, ending the day firmly in the red and significantly below both its opening price and the previous day’s close.
1.5 The Twilight Zone: After-Hours and Pre-Market Whispers
The chart continues past the 4:00 PM close, showing the thin, grey line of after-hours and pre-market trading. The price action here is muted, hovering around the closing price. This is a low-volume environment where only a limited number of investors can participate. Yet, the screenshot provides a crucial clue about the future: the “Pre-market” data, showing a price of $270.68, down another $1.12 or 0.41%. This indicates that the negative sentiment from the trading day was spilling over, promising another difficult start for the next session. The battle was over for the day, but the war for Broadcom’s stock price was set to continue.
Chapter 2: The Juggernaut Behind the Ticker – Understanding Broadcom Inc.
To interpret the fluctuations of a stock, one must first understand the fundamental nature of the underlying company. Broadcom Inc. is not just any company; it is a sprawling, powerful, and often controversial titan of the technology industry. Its current form is the result of a relentless and audacious strategy of acquisition, masterminded by its famously pragmatic CEO, Hock Tan. Understanding this history and its business model is essential to grasping why its stock behaves the way it does.
2.1 A Legacy of Consolidation: From HP to Avago to Broadcom
The company we know today as Broadcom has a lineage that traces back to the semiconductor division of Hewlett-Packard. This division was spun off as Agilent Technologies, which then spun off its own semiconductor group as Avago Technologies in 2005. For the next decade, under the leadership of Hock Tan, Avago grew into a formidable player, not through organic innovation alone, but through a series of shrewd, large-scale acquisitions, including LSI Corporation.
The transformative moment came in 2016. In a move that stunned the industry, the smaller Avago acquired the much larger and more famous Broadcom Corporation for a staggering $37 billion. In a testament to the power of the Broadcom brand, Avago chose to rename the combined entity Broadcom Inc. This was not merely a merger; it was the creation of a new kind of semiconductor company—one built on the principle of dominating profitable, well-established markets and ruthlessly cutting costs in areas that didn’t meet its stringent profitability criteria.
Hock Tan’s playbook became legendary: identify market leaders with “sticky” customer relationships, acquire them, integrate their most profitable product lines, and divest or wind down the rest. This strategy continued with the audacious, and ultimately failed, hostile takeover attempt of rival Qualcomm in 2018, which was blocked by the U.S. government on national security grounds. Undeterred, Tan pivoted, moving the company’s headquarters from Singapore to the U.S. and shifting his focus to software, acquiring enterprise software giant CA Technologies in 2018 and Symantec’s enterprise security business in 2019. This strategic diversification is key to understanding the modern Broadcom.
2.2 The Two Pillars: Semiconductor Solutions and Infrastructure Software
Broadcom today operates on two main pillars, each with a different strategic purpose.
-
Pillar 1: Semiconductor Solutions (The Engine of Growth and Innovation)
This remains the heart of Broadcom. The company does not try to be everything to everyone. Instead, it focuses on product categories where it can be the #1 or #2 player in the world. Its products are the critical, high-performance components that underpin modern digital infrastructure.-
Networking: Broadcom is the undisputed king of switching and routing silicon that powers the world’s data centers. Companies like Google, Amazon (AWS), Microsoft (Azure), and Facebook (Meta) rely on Broadcom’s “Tomahawk” and “Trident” chips to build the massive networks that run their cloud services.
-
Broadband: If you have a high-speed internet connection at home, chances are your modem or router contains Broadcom silicon. They are a dominant force in DOCSIS, DSL, and fiber-optic modem technology.
-
Wireless: This is one of their most famous segments. Broadcom is a key supplier to Apple, providing a suite of complex radio-frequency (RF) and wireless chips that are essential for the iPhone’s Wi-Fi, Bluetooth, and cellular connectivity. This relationship, while lucrative, also represents a significant concentration risk, as Apple is by far its largest customer.
-
Storage and Industrial: The company also provides custom silicon for enterprise storage systems (hard drives, data centers) and various industrial applications, leveraging the technology acquired from LSI and others.
-
-
Pillar 2: Infrastructure Software (The Bastion of Cash Flow)
The acquisitions of CA Technologies and Symantec’s security arm were initially met with confusion by Wall Street. Why would a hardware company buy legacy software businesses? Hock Tan’s logic was clear: these businesses, while not high-growth, served large enterprise customers with critical needs (like mainframe management and cybersecurity). These customers were “sticky” and unlikely to switch providers, generating highly predictable, recurring revenue and massive cash flows.
This software segment acts as a financial ballast for the company. The semiconductor industry is famously cyclical, with booms and busts tied to consumer demand and technological shifts. The stable, subscription-based revenue from the software division provides a powerful cushion, allowing Broadcom to continue investing in R&D and, crucially, to maintain and grow its dividend even during downturns in the chip market.
2.3 The Competitive Moat and Key Risks
Broadcom’s competitive advantage, or “moat,” is built on several factors:
-
Technological Leadership: In its chosen niches, its engineering is world-class.
-
Scale and Manufacturing Prowess: As a “fabless” company (it designs chips but outsources manufacturing to foundries like TSMC), its massive order volumes give it preferential pricing and access to cutting-edge production processes.
-
Deep Customer Integration: Its products are designed in close collaboration with customers like Apple and Cisco. Switching to a competitor would require a costly and time-consuming redesign on the customer’s part.
However, the company also faces significant risks. Its reliance on Apple is a perennial concern for investors. Its aggressive, debt-fueled acquisition strategy carries financial risk. And most importantly, it operates at the epicenter of the US-China geopolitical conflict, making it vulnerable to trade wars and supply chain disruptions. These factors create the undercurrent of anxiety that can turn a day’s trading from optimistic to bearish, as seen in the chart.
Chapter 3: Decoding the Dashboard – A Deep Dive into the Financial Metrics
The block of numbers at the bottom of the stock summary is where the day’s price action meets the company’s long-term financial reality. Each metric tells a piece of the story, and together they paint a portrait of a company that is immensely valuable, highly profitable, but potentially overstretched in its valuation. Let’s break down each data point.
3.1 Market Cap: 1.28L Cr – The Sheer Scale of a Global Leader
The “Mkt cap” is listed as “1.28L Cr.” This notation, “Lakh Crore,” is specific to the Indian numbering system. One Lakh is 100,000, and one Crore is 10,000,000. Therefore, one Lakh Crore is equal to 1 trillion (10^12) Rupees. So, Broadcom’s market capitalization here is 1.28 trillion Indian Rupees.
To put this in a global context, we must convert it to U.S. dollars. The exchange rate in mid-2020 (the likely period of this screenshot, given the price history) was approximately 75 INR to 1 USD.
-
1,280,000,000,000 INR / 75 INR/USD = **~ $170.7 billion USD**
A market capitalization of over $170 billion places Broadcom firmly in the upper echelon of global corporations. It is a valuation that reflects the market’s belief in the company’s dominant market position, its profitability, and its future growth prospects. It signifies a company that is “too big to ignore” for major investment funds and a bellwether for the entire semiconductor sector. However, such a large valuation also means the company must deliver consistently spectacular results to justify it. Any sign of weakness can lead to significant dollar-value losses in its stock, even with a small percentage drop. The 0.87% decline on this day, for instance, represented a loss of market value of approximately $1.48 billion—a figure larger than the entire valuation of many smaller public companies.
3.2 P/E Ratio: 102.16 – The Elephant in the Room
This is arguably the most startling number on the dashboard. The Price-to-Earnings (P/E) ratio of 102.16 is exceptionally high. The P/E ratio is a fundamental valuation metric calculated by dividing the stock’s current price by its earnings per share (EPS) over the past twelve months. In simple terms, it tells you how much investors are willing to pay for one dollar of the company’s past earnings.
To put 102.16 into perspective:
-
The historical average P/E ratio for the S&P 500 index is around 15-20.
-
In mid-2020, even in a bull market, the S&P 500 P/E was in the 25-30 range.
-
Mature, stable companies often trade at P/Es of 10-25.
-
Fast-growing technology companies can command higher P/Es of 30-50, but a figure over 100 is typically reserved for early-stage, speculative biotech or software companies with little to no current earnings but enormous perceived future potential.
So, why would a mature, profitable behemoth like Broadcom have a P/E ratio of over 100? There are several possible explanations, and the truth is likely a combination of them:
-
Suppressed Trailing Earnings: The “E” in the P/E ratio is based on past earnings. Large acquisitions, like those of CA and Symantec, often come with significant one-time costs related to integration, restructuring, and accounting charges for amortization of intangible assets. These accounting charges can temporarily depress reported “GAAP” (Generally Accepted Accounting Principles) earnings, making the P/E ratio appear artificially high. Many analysts prefer to look at “non-GAAP” or “adjusted” earnings, which exclude these items, and would result in a much lower P/E ratio.
-
Extreme Growth Expectations: The market may be pricing in an enormous acceleration of future earnings. A high P/E signifies a belief that the “E” is about to grow very rapidly, which would quickly bring the ratio down to a more normal level. For Broadcom, this would be tied to the explosion in demand from the 5G rollout, the continued build-out of cloud data centers, and the successful integration of its software acquisitions.
-
“Quality” Premium: Broadcom is considered a “best-in-class” operator. The market may be willing to pay a significant premium for Hock Tan’s leadership, the company’s dominant market positions, and its consistent cash flow generation.
-
Market Froth: It is also possible that, in a market fueled by low interest rates and stimulus, investors were simply willing to pay almost any price for large-cap tech growth stories, leading to bubble-like valuations across the sector.
Regardless of the reason, a P/E of 102.16 creates a precarious situation. It means the stock is priced for perfection. Any disappointment in future earnings reports, any guidance that suggests growth is slowing, could lead to a dramatic and painful “re-rating” of the stock, where the P/E multiple contracts sharply, causing the stock price to fall even if the underlying business remains strong. This high valuation likely contributed to the selling pressure on the day in question; it’s easier to take profits on a stock that appears expensive.
3.3 Dividend Yield (0.87%) and Quarterly Dividend Amt (0.59)
These two metrics provide a fascinating counterpoint to the high P/E ratio. While the P/E screams “speculative growth,” the dividend signals “stable shareholder returns.”
-
Quarterly Dividend Amount: $0.59. This means the company pays $0.59 to shareholders for every share they own, every three months. This translates to an annual dividend of $0.59 x 4 = $2.36 per share.
-
Dividend Yield: 0.87%. This is the annual dividend as a percentage of the stock price ($2.36 / $271.80 = 0.87%).
For a major tech company, paying a dividend is a sign of financial maturity and discipline. It demonstrates that the company generates more cash than it needs for its own operations and R&D, and it is committed to returning that excess capital to its owners. Under Hock Tan, Broadcom has a strong history of aggressive dividend growth. This policy is a core part of the investment thesis for many long-term shareholders. It provides a steady income stream and acts as a vote of confidence from management in the company’s future cash-generating ability. The relatively low yield of 0.87% is a function of the high stock price; as the price has risen, the yield has fallen. Nonetheless, the existence of a substantial and growing dividend provides a measure of support for the stock price and appeals to a different class of investor than those purely chasing capital gains.
3.4 52-Week Range: $128.50 – $277.70 – A Story of Panic and Euphoria
This single data point encapsulates the immense drama of the preceding year. The range between the low and the high is enormous, with the high being more than double the low. This tells a powerful story:
-
The Low ($128.50): This price almost certainly corresponds to the nadir of the COVID-19 market crash in March 2020. In a matter of weeks, global markets panicked as the world went into lockdown. Investors feared a deep and prolonged recession that would cripple supply chains and destroy consumer demand. Broadcom, being a cyclical semiconductor company at the heart of the global supply chain, was hit particularly hard.
-
The High ($277.70): The recovery from the low was nothing short of breathtaking. This high represents the peak of a massive rally that occurred in the months following the crash. Investors quickly realized that the pandemic, while devastating for many industries, was actually a massive tailwind for technology. Work-from-home, streaming entertainment, e-commerce, and cloud computing all saw unprecedented demand, which directly translated into demand for Broadcom’s networking, broadband, and data center products. The market was flooded with government stimulus and central bank liquidity, and investors poured that money into the tech giants that were perceived as the “winners” of the new economy.
The day’s trading range, with a high of $276.34, shows the stock was trading just shy of its 52-week high. It was testing its peak, a critical moment for any stock. The failure to break out to a new high and the subsequent reversal suggest that investors were becoming hesitant. The easy gains from the post-crash rally were over, and a period of consolidation and profit-taking was beginning. The stock had come too far, too fast, and the day’s decline was a natural consequence of that incredible run.
Chapter 4: The Bigger Picture – Industry Tailwinds and Geopolitical Storms
No company is an island. Broadcom’s performance on any given day is inextricably linked to the powerful currents flowing through its industry and the global economy. To fully understand the 0.87% drop, we must zoom out and examine the landscape in which Broadcom operates—a landscape defined by generational technological shifts and unprecedented geopolitical tension.
4.1 Riding the Wave: The Semiconductor Super-Cycle
Broadcom is a primary beneficiary of several long-term, secular growth trends that are often collectively referred to as a “semiconductor super-cycle.” These are not temporary fads but fundamental transformations in how the world works.
-
The 5G Revolution: The global transition from 4G to 5G wireless technology is a monumental undertaking. 5G promises not just faster phone downloads, but a new era of connectivity for cars, factories, and smart cities. Every new 5G smartphone requires more complex and expensive wireless components than its 4G predecessor. Broadcom, with its best-in-class FBAR filters and other RF components, is a critical supplier for high-end smartphones, most notably the Apple iPhone. As hundreds of millions of consumers upgrade to 5G phones in the coming years, it represents a massive and sustained tailwind for Broadcom’s wireless division.
-
The Cloud and Data Center Explosion: The shift to cloud computing is relentless. Businesses are moving their IT infrastructure to services like Amazon Web Services, Microsoft Azure, and Google Cloud. This, combined with the rise of data-intensive applications like artificial intelligence, machine learning, and video streaming, has created an insatiable demand for data centers. These data centers are essentially giant warehouses filled with servers, all connected by high-speed networks. Broadcom is the dominant supplier of the networking chips that form the backbone of these data centers. As data continues to grow exponentially, so too does the demand for Broadcom’s switching and routing silicon.
-
The Internet of Things (IoT): While still in its early stages, the proliferation of connected devices—from smart speakers and thermostats in the home to sensors in industrial machinery—represents another long-term growth vector. Each of these billions of devices requires low-power Wi-Fi and Bluetooth chips, a market where Broadcom is a major player.
These powerful tailwinds are the primary justification for Broadcom’s high valuation. Investors are betting that these trends are so strong they will power the company’s growth for years to come, overcoming any short-term economic or political disruptions.
4.2 The Geopolitical Chessboard: The US-China Tech War
If the super-cycle is the wind in Broadcom’s sails, geopolitics is the storm on the horizon. The escalating strategic competition between the United States and China has placed the entire semiconductor industry at its epicenter. This conflict manifests in several ways that directly impact Broadcom:
-
Tariffs and Trade Barriers: The imposition of tariffs on goods traded between the two countries increases costs and complicates supply chains. While Broadcom is a U.S. company, it has significant operations and customers in China, and its manufacturing partners are primarily in Asia.
-
The “Entity List”: The U.S. government has placed several Chinese technology companies, most notably Huawei, on an “Entity List,” which effectively forbids American companies from selling them technology without a special license. Huawei was once a major customer for Broadcom. The loss of this revenue stream was a significant blow and a stark reminder of how quickly political decisions can impact the bottom line.
-
Technological Sovereignty: The conflict has spurred both the U.S. and China to pursue “technological sovereignty.” China is investing hundreds of billions of dollars to build its own domestic semiconductor industry to reduce its reliance on Western technology. The U.S. is likewise incentivizing the “onshoring” of chip manufacturing to secure its own supply chain. This long-term trend could eventually create powerful new competitors for Broadcom and reshape the global landscape of the industry.
This geopolitical overhang creates a persistent risk factor for Broadcom’s stock. Any negative news on the US-China front—a new round of tariffs, an expansion of the Entity List, or escalating rhetoric—can trigger immediate selling pressure on semiconductor stocks. It is a constant source of uncertainty that tempers the optimism generated by the industry’s growth trends.
4.3 The Macroeconomic Climate: A World of Stimulus and Uncertainty
The trading day in question occurred within a unique and paradoxical economic environment. The COVID-19 pandemic had triggered a severe global recession, with millions unemployed and entire industries shuttered. Yet, at the same time, stock markets were roaring, particularly the tech-heavy NASDAQ index.
This disconnect was a direct result of the unprecedented response from governments and central banks. The U.S. Federal Reserve had cut interest rates to zero and launched massive quantitative easing programs, injecting trillions of dollars of liquidity into the financial system. The U.S. government passed enormous fiscal stimulus packages, sending checks directly to citizens and providing support to businesses. This wall of money had to go somewhere, and much of it flowed into the stock market. With interest rates at zero, the return on safe assets like bonds was negligible, forcing investors to take on more risk in equities to seek returns.
Technology stocks like Broadcom were the primary beneficiaries. They were seen as “COVID-proof” or even “COVID-positive” businesses, whose growth was accelerating due to the pandemic. This flood of liquidity helped inflate valuations across the sector, contributing to Broadcom’s P/E of 102. However, it also created a fragile and nervous market. Investors knew that this rally was built on a foundation of government support, and any sign that the support might be withdrawn, or that the underlying economic reality was worse than feared, could prick the valuation bubble. This underlying tension between market euphoria and economic reality made the market prone to sharp, sudden pullbacks, like the one Broadcom experienced on this day.
A Single Day, A Universe of Meaning
We return to where we began: a closing price of $271.80, a loss of $2.38, a decline of 0.87%. In isolation, it is a footnote in the company’s history. But as we have seen, this single data point is a portal to a far richer and more complex story.
The day’s trading was a narrative of failed optimism, where an enthusiastic open was decisively rejected, leading to a steady decline driven by profit-taking and a sober reassessment of the stock’s lofty valuation. It was a day that reflected the inherent tension within Broadcom’s identity.
On one hand, we have Broadcom the unstoppable juggernaut. It is a masterfully managed company that dominates critical, high-growth technology markets. It is a key enabler of the 5G and cloud revolutions, with a fortress-like competitive moat built on technology, scale, and deep customer relationships. Its strategic move into software provides a stabilizing cash flow, funding a robust and growing dividend that signals financial strength and rewards long-term investors.
On the other hand, we have Broadcom the high-wire act. Its stock trades at a precarious P/E ratio that prices in years of flawless execution and leaves no room for error. It is heavily exposed to the whims of a single, powerful customer in Apple. It stands at the volatile epicenter of the US-China geopolitical conflict, where a single policy decision can reshape its future. And its stellar performance in the year leading up to this day was fueled, in part, by a wave of unprecedented market stimulus that could not last forever.
The 0.87% drop was a manifestation of this tension. It was the market taking a brief pause, a moment of collective intake of breath after a dizzying ascent. It was the whisper of doubt about the 102 P/E ratio, the shadow of geopolitical risk, and the simple, human impulse to lock in profits after a spectacular run.
For investors, the story of this single day serves as a powerful reminder. Investing in a company like Broadcom is a bet on the continuation of powerful technological tailwinds, but it requires a stomach for the volatility that comes with high expectations and global uncertainty. The numbers on the screen are more than just data; they are the daily verdict in a continuous debate about the future. And on this day, the verdict for Broadcom Inc., however slight, was a step back from the peak, a quiet acknowledgment that even for the mightiest of giants, the path forward is never a straight line.


