Berkshire Hathaway’s Volatile Day: A Deep Dive into the Micro-Movements and Macro-Picture of a Wall Street Titan

OMAHA, NE – In a trading session that encapsulated both the market’s skittishness and the underlying resilience of a corporate giant, shares of Berkshire Hathaway Inc. Class A (NYSE: BRK.A) navigated a volatile path on Monday, July 8th, ultimately closing in negative territory. The day’s performance, while seemingly minor in percentage terms, offers a rich tapestry of data for investors, providing a window into intraday sentiment, long-term valuation, and the enduring legacy of the world’s most famous conglomerate.
By the 4:00 PM GMT-4 closing bell, the perennially high-priced stock settled at
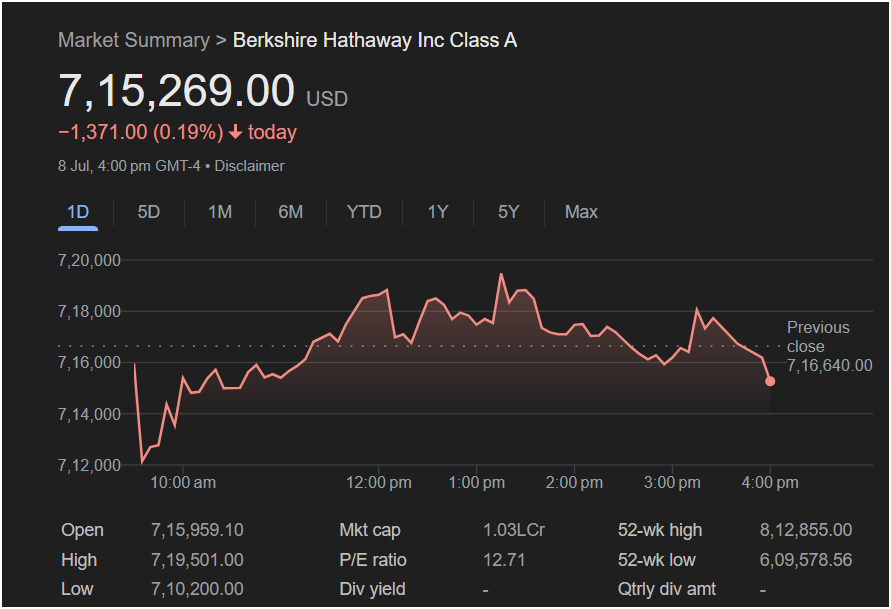
1,371.00, or 0.19%, from the previous close. While a four-figure drop might seem alarming for any other stock, for the titan of Omaha, it was but a ripple in a vast ocean. However, the story of the day was not in its modest final change, but in the dramatic intraday journey the stock undertook, a journey that saw it swing nearly $9,300 from its lowest to highest point.
This article will provide an exhaustive analysis of the July 8th trading session for Berkshire Hathaway, breaking down the day’s narrative, placing it within a broader market and historical context, and exploring the fundamental metrics that continue to make it a cornerstone of global finance.
Part I: The Anatomy of a Trading Day – A Minute-by-Minute Narrative
The provided screenshot offers a granular, one-day (1D) view of BRK.A’s price action, a classic example of a “V-shaped recovery followed by a late-day fade.” To understand the psychology of the market on this day, we must dissect the chart’s timeline.
The Opening Bell and the Morning Plunge (Pre-10:00 AM to 10:15 AM)
The market opened with Berkshire Hathaway shares showing immediate signs of weakness. The stock’s opening price was $715,959.10. This was already below the previous close of $7,16,640.00, indicating a negative sentiment carrying over from the prior session or developing in pre-market trading.
What followed was a sharp, decisive sell-off. In the first hour of trading, the price cascaded downwards, carving out the day’s absolute low of $7,10,200.00. This nearly $5,800 drop from the open suggests a wave of selling pressure, which could be attributed to several factors:
-
Broad Market Weakness: Often, the opening hour is dictated by overnight news, futures trading, and macroeconomic data releases. A general “risk-off” sentiment across the market could have dragged down even a stalwart like Berkshire.
-
Profit-Taking: Given Berkshire’s strong performance over the past year (as we’ll explore later), some investors may have used the opening bell as an opportunity to lock in gains.
-
Large Institutional Orders: The sheer price of a single BRK.A share means that trading is dominated by institutions. A single large sell order from a fund rebalancing its portfolio can create such a dip.
For those watching the ticker, this initial plunge would have been the day’s most dramatic moment, testing the resolve of short-term holders and offering a potential entry point for dip-buyers.
The Midday Rally and the Ascent to the Peak (10:15 AM to 1:30 PM)
Just as quickly as it fell, the stock found its footing. The $710,200 level acted as a firm support base. From this nadir, a powerful recovery began. This reversal signifies that buyers perceived the morning’s price as a bargain. Bargain hunters and algorithmic trading systems likely identified the stock as being “oversold” on an intraday basis and began accumulating shares.
The ascent was not a straight line but a series of higher highs and higher lows, indicative of a healthy, accumulating rally. The price steadily climbed past the $712,000, $714,000, and $716,000 marks, erasing the day’s earlier losses and pushing into positive territory.
This bullish momentum culminated around 1:30 PM, where the stock reached its zenith for the session: the day’s high of $719,501.00. This peak represented a remarkable comeback of $9,301 from the morning’s low. This midday strength could have been fueled by:
-
A Reversal in Broader Market Sentiment: News or sentiment may have shifted from negative to positive during the day, lifting all boats.
-
Value Recognition: Investors, seeing Berkshire Hathaway nearly 1% down on the day, may have stepped in, reaffirming their faith in the company’s long-term value proposition.
-
Lack of Follow-Through Selling: The initial sellers may have exhausted their orders, leaving a vacuum that buyers were eager to fill.
The Afternoon Fade and the Weak Close (1:30 PM to 4:00 PM)
The peak at $719,501.00 proved to be a formidable resistance level. Having failed to push higher, the stock began a slow, grinding descent for the remainder of the afternoon. This “fade” is a common pattern where the midday optimism wanes and gives way to profit-taking ahead of the close.
The price gradually retreated from its highs, falling back below the $718,000 and eventually the $716,000 levels. The chart shows a consistent downward drift, punctuated by small, failed attempts to bounce. This price action suggests that the bullish conviction had dissipated.
As the 4:00 PM closing bell approached, the selling pressure intensified slightly, pushing the price down to its final print of $715,269.00. This close was significant for several reasons:
-
It was well off the day’s high, indicating the bears won the final battle of the day.
-
It was below the previous day’s close of $716,640.00, cementing a loss for the session.
-
It was, however, significantly above the day’s low, showcasing the market’s willingness to defend the stock at lower levels.
In summary, the trading day for BRK.A was a microcosm of market dynamics: an initial fear-driven sell-off, a value-driven recovery, and a final period of cautious profit-taking.
Part II: Zooming Out – Contextualizing the Day’s Data
A single day of trading is merely a pixel in a much larger picture. The additional data provided in the screenshot allows us to place this volatile session into its proper long-term context.
The 52-Week Perspective: Closer to the Sun than the Sea
The screenshot provides the 52-week high of $812,855.00 and the 52-week low of $609,578.56. This range of over $203,000 is a testament to the stock’s significant appreciation over the past year.
The closing price of $715,269.00 sits firmly in the upper half of this range. It is approximately $97,586 (or about 12%) below its all-time high, but a substantial $105,690 (or about 17.3%) above its 52-week low. This positioning suggests that despite the minor loss on this particular day, the stock remains in a powerful long-term uptrend. Investors who have held the stock over the last year have been handsomely rewarded, and the day’s dip is unlikely to concern them.
Valuation Analysis: The P/E Ratio
The provided P/E (Price-to-Earnings) ratio is 12.71. This metric is crucial for understanding a company’s valuation relative to its profitability. A P/E of 12.71 means that investors are willing to pay $12.71 for every $1 of Berkshire Hathaway’s annual earnings.
In today’s market, where many technology and growth stocks trade at P/E ratios of 30, 50, or even higher, a P/E of 12.71 is exceptionally low. This is characteristic of “value” stocks, which is the very heart of the Berkshire Hathaway philosophy pioneered by Warren Buffett and Charlie Munger.
This low P/E ratio suggests several things:
-
The Market Views Berkshire as a Mature, Stable Entity: It is not expected to grow at the explosive rates of a startup, so its earnings are not awarded a high multiple.
-
A Margin of Safety: A low P/E can indicate that the stock is not overvalued and may have less downside risk in a market correction compared to its high-multiple peers.
-
Profitability and Efficiency: It reflects the immense, stable earnings power of Berkshire’s diverse portfolio of businesses, from insurance (GEICO) and railroads (BNSF) to energy (Berkshire Hathaway Energy) and consumer goods (See’s Candies, Duracell).
Market Capitalization: A Trillion-Dollar Behemoth
The screenshot displays a Market cap of 1.03LCr. This notation, “LCr” for “Lakh Crore,” is common in the Indian numbering system.
-
1 Lakh = 100,000
-
1 Crore = 10,000,000
-
1 Lakh Crore = 1,000,000,000,000 (which is one trillion)
Therefore, 1.03LCr translates to approximately $1.03 Trillion USD. This places Berkshire Hathaway in an elite club of the world’s most valuable companies. Its sheer size has profound implications:
-
Stability: It is too large and diversified to be significantly impacted by the failure of any single one of its businesses.
-
Economic Bellwether: Its performance is often seen as a proxy for the health of the U.S. economy itself, given its deep holdings in fundamental sectors like transportation, insurance, utilities, and finance.
-
The Law of Large Numbers: Its massive size also means that finding new investments large enough to meaningfully impact its overall growth becomes increasingly difficult—a challenge Warren Buffett has often spoken about.
Dividend Policy: The Power of Compounding
Notably, the Div yield (Dividend yield) and Qtrly div amt (Quarterly dividend amount) fields are both marked with a dash (“-“). This is not an error. Berkshire Hathaway is famously one of the few blue-chip giants that does not pay a dividend.
Warren Buffett has long argued that he and his team can generate better returns for shareholders by retaining the company’s earnings and reinvesting them in new acquisitions or existing businesses, rather than distributing them as cash dividends. The historical performance of the stock is the primary evidence for this thesis. By reinvesting profits, Berkshire has been able to compound its value at an extraordinary rate for decades. Shareholders who desire income must generate it by selling a small portion of their shares. This long-standing policy is a core tenet of the company’s identity.
Part III: The Berkshire Hathaway Mystique – Beyond the Numbers
To fully understand the context of this single trading day, one must appreciate the unique nature of the company itself.
The Conglomerate Structure: Berkshire is not a company; it is a universe. It is a holding company that owns dozens of subsidiary companies outright and holds massive stock positions in others. Its largest public stock holding is famously in Apple Inc. (AAPL), but its wholly-owned businesses form the bedrock of its earnings power. This diversification across industries and asset types provides a level of resilience that few other corporations can match.
The Buffett-Munger Legacy and Succession: For decades, the company was synonymous with its two masterminds: Warren Buffett and the late Charlie Munger. Their philosophy of value investing, focusing on businesses with durable competitive advantages (“economic moats”), and holding for the long term, is legendary. With Munger’s passing and Buffett in his 90s, the market is keenly focused on the succession plan. Vice-Chairmen Greg Abel (designated to become CEO) and Ajit Jain (head of insurance operations) are now the public faces of the company’s future. Any perceived wobble in the market can sometimes be speculatively tied to the post-Buffett era, though the culture and decentralized structure of Berkshire are designed for continuity.
Why Class A Shares Are So Expensive: The astronomical price of BRK.A is a direct result of Buffett’s decision never to split the stock. He believed this would attract long-term, serious investors and discourage short-term speculators. To make ownership more accessible, the company introduced Class B shares (BRK.B) in 1996, which trade at a fraction of the price of Class A shares and offer proportionally smaller voting rights.
A Day of Noise in a Symphony of Value
The trading session of July 8th for Berkshire Hathaway Inc. Class A was a textbook example of intraday volatility. It began with fear, was resurrected by value-seeking, and concluded with caution. The final tally—a minor loss of 0.19%—belies the nearly $9,300 rollercoaster ride that investors witnessed between the morning low and the afternoon high.
However, when we zoom out, this single day is put into its proper perspective. It is a fleeting moment in the life of a $1.03 trillion titan that remains in a long-term uptrend, trades at a conservative valuation, and is built on a foundation of diversified, profitable businesses. For the long-term investors that Warren Buffett has always sought to attract, the intraday gyrations are but market noise. The true signal lies in the enduring principles of value, patience, and compounding that have defined Berkshire Hathaway for over half a century and are reflected in the fundamental data that underpins its colossal market presence.
Disclaimer: This article is an analysis of publicly available financial data from a specific point in time and is for informational purposes only. It does not constitute financial or investment advice. All investors should conduct their own research and consult with a qualified financial advisor before making any investment decisions.


