AT&T at a Standstill: A Deep Dive into the Volatile Churn of a High-Yield Giant Testing Its Peak

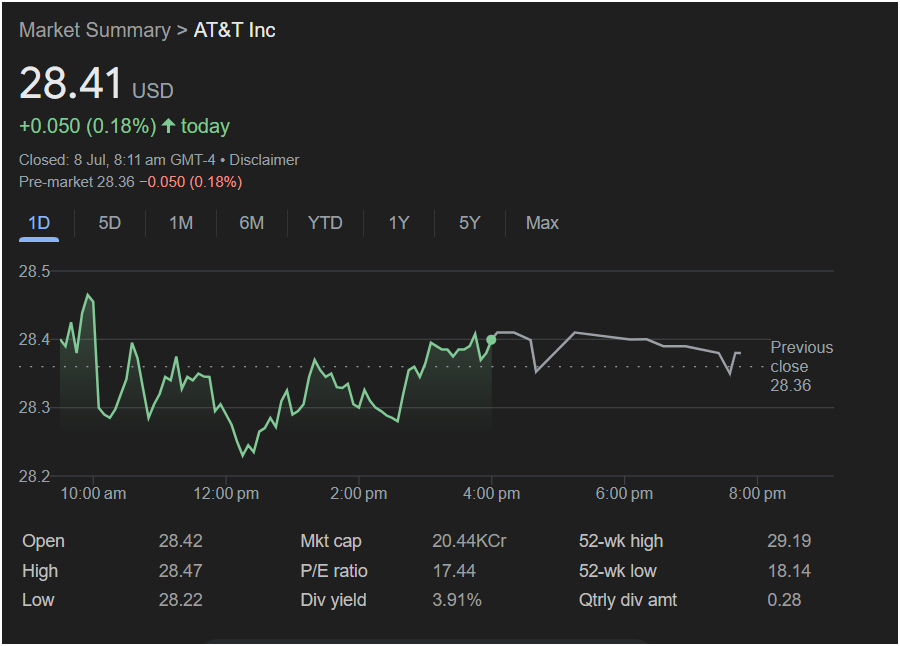
NEW YORK, NY – AT&T Inc. (NYSE: T), the venerable telecommunications titan and a cornerstone of income-oriented portfolios, ended the trading day in a state of virtual equilibrium, closing at 28.41 USD. The stock posted a negligible gain of +0.050 points, or a mere 0.18%. However, this deceptively quiet closing figure masks a session of significant intraday volatility and investor indecision, as the stock churned aggressively just shy of its 52-week high.
Adding to the day’s theme of stasis, pre-market trading is indicating a drop that would precisely erase the day’s minor gain, suggesting the market’s tug-of-war over AT&T’s future is far from over. This exhaustive analysis will dissect the session’s turbulent price action and delve into the fundamental metrics that define AT&T’s unique position as a high-yield value play in a market questioning its next move.
 Section 1: The Anatomy of a Directionless Day – Charting the Tug-of-War
The intraday line chart for AT&T is a textbook illustration of a “range-bound” or “consolidating” market. It’s a narrative not of a clear trend, but of a fierce and unresolved battle between buyers and sellers, resulting in a day of sound and fury, signifying (almost) nothing in terms of net change.
The Opening Volatility:
The session began with a burst of activity. From a previous close of 28.36 USD, the stock opened higher at 28.42 USD. In the first 30 minutes, buyers made an aggressive push, driving the stock to its intraday high of 28.47 USD. This initial move suggested bullish intent, aiming to build on recent momentum and push toward the 52-week peak.
However, this optimism was immediately and forcefully challenged. The initial spike was met with a significant wave of selling that drove the stock down sharply, past its opening price and all the way to its intraday low of 28.22 USD. This sharp ~1% swing from the high to the low within the first hour established a wide and volatile trading range for the rest of the day. It was a clear signal that sellers were actively defending the levels near the 52-week high.
The Midday Churn: A Market in Search of Direction (11:00 am – 4:00 pm)
After the initial chaotic hour, the stock entered a prolonged period of intense churn. The chart displays a classic “W” pattern, or a double bottom, followed by subsequent oscillations.
-
The Tug-of-War: The price action saw the stock rally off its lows near 28.22, climb back toward the 28.40 level, get rejected, fall again, find support, and rally once more. This back-and-forth grind is indicative of a market in perfect, albeit tense, equilibrium. Every buying attempt was met with selling, and every selling attempt was met with buying.
-
Institutional Battleground: This type of price action often reflects large institutional players on both sides of the trade. Some funds, attracted by the dividend and recent momentum, are likely buying on dips. Other funds, concerned about the stock’s proximity to its peak valuation or broader economic headwinds, are likely selling into strength. The result is this violent, sideways churn.
The stock made a final push toward its daily high in the late afternoon before fading slightly into the 4:00 pm close. The final print of 28.41 USD landed squarely in the middle of this contentious battlefield.
Section 2: The Core Investment Thesis – A Deep Dive into AT&T’s Financials
To understand why the market is so conflicted, we must look at the fundamental metrics that define AT&T’s investment case. It’s a story of an attractive income stream running headlong into questions about growth and valuation.
Dividend Yield: 3.91% – The Unquestionable Star of the Show
The single most important metric for AT&T is its dividend yield of 3.91%. Based on a quarterly dividend of 0.28 USD (or 1.12 USD annually), this is the primary reason many investors own the stock.
-
The Income Engine: A yield nearing 4% is exceptionally high in today’s market, especially from a mega-cap company. It provides a substantial and regular cash return to shareholders. This powerful income stream acts as a powerful gravitational pull on the stock, attracting retirees, pension funds, and all manner of income-seeking investors.
-
The Support Mechanism: The high dividend provides a strong “cushion” or valuation support for the stock price. If the price were to fall significantly, the yield would become even higher, attracting new waves of buyers looking for a bargain on that income stream. This dynamic helps to limit downside risk and explains why buyers were so willing to step in at the day’s lows.
52-Week Range (18.14 – 29.19 USD): A Story of Powerful Recovery
The context of the day’s trading is framed by this massive range. The closing price of 28.41 USD is just 2.7% below its 52-week high of 29.19 USD. More importantly, it is a staggering 57% above its 52-week low of 18.14 USD.
-
Implication 1: Strong Bullish Momentum. The stock has been on a tremendous run over the past year, recovering from deeply pessimistic levels. This powerful uptrend has been a major tailwind.
-
Implication 2: A Rally Pausing for Breath. The indecisive, choppy price action is classic behavior for a stock that has experienced a massive rally and is now approaching a key resistance level (the 52-week high). The “easy money” has been made, and now the market is pausing to digest the gains and ask, “What’s next?” The churn reflects this period of consolidation and price discovery at a new, higher plateau.
P/E Ratio: 17.44 – A Mark of Fair Value
AT&T’s Price-to-Earnings (P/E) ratio of 17.44 reinforces its identity as a value stock.
-
Interpretation: Like Abbott Labs in the previous analysis, this is a “Goldilocks” valuation. It’s not high enough to suggest speculative froth, and it’s not low enough to signal deep distress. It indicates that the market is pricing AT&T as a mature, stable business with modest growth prospects, which is an accurate reflection of its reality. This reasonable P/E, combined with the high dividend, forms the bedrock of the bullish value thesis.
Market Capitalization: 20.44KCr
The market cap of 20.44KCr (Thousand Crores) translates to 20,440 Crore Rupees. At a standard conversion rate (~83 INR/USD), this equates to a market capitalization of approximately $246 Billion USD.
-
Implication: AT&T is a corporate behemoth. Its massive size and entrenchment in the U.S. telecom infrastructure make it a slow-moving but foundational part of the economy. Its performance is often seen as a barometer for the broader value segment of the market.
Section 3: The Pre-Market Signal – A Perfect Reflection of Indecision
The pre-market data provides a final, poetic touch to the day’s narrative. The stock is indicated at 28.36 USD, a loss of -0.050 (0.18%).
-
Analysis: This is a perfect mirror image of the previous day’s close. The pre-market move is poised to completely erase the regular session’s gain. This is the ultimate symbol of the market’s current stasis regarding AT&T. After a full day of volatile trading, the net result is zero. It strongly suggests that the tug-of-war will continue and that the stock is unlikely to break out of its current range without a significant new catalyst.
A High-Yield Giant in Perfect, Tense Equilibrium
The trading session for AT&T Inc. was a masterclass in market indecision. While the stock closed with a fractional gain, the real story was the violent churn within a tight range, a clear sign of a market at war with itself. The bullish forces—a powerful year-long recovery and a best-in-class dividend yield—are crashing head-on into the bearish forces of a stock testing the limits of its valuation near a 52-week peak.
AT&T is a stock caught in a moment of perfect, tense balance. It is a safe harbor for income investors, but a source of caution for those wary of buying at the top of a major run. The pre-market data confirms this state of equilibrium. The stock is waiting for a tie-breaking vote, which will likely come in the form of its next earnings report, a change in interest rate expectations, or a major strategic announcement. Until then, investors should expect the churn to continue.
Disclaimer: This article is a comprehensive analysis based on the provided screenshot and general market principles. It is intended for informational and educational purposes only and does not constitute financial advice. All investment decisions should be made in consultation with a qualified financial professional.