
NEW YORK, NY – Abbott Laboratories (NYSE: ABT), a diversified healthcare and medical technology bellwether, concluded the trading session in negative territory, closing at 133.70 USD. The stock registered a modest loss of -0.74 points, or 0.55%. However, the headline number belies a day of intense intraday volatility that saw early weakness dramatically reversed by a powerful surge of buying into the market close, a move that suggests deep-pocketed investors may be stepping in.
 With a moderately positive pre-market signal adding to the late-day optimism, the session serves as a fascinating case study in institutional behavior and the resilience of a blue-chip stalwart. This in-depth analysis will meticulously dissect the day’s turbulent price action and explore the fundamental metrics that anchor Abbott’s standing as a core holding for investors worldwide.
Section 1: The Tale of Two Sessions – A Forensic Analysis of the Intraday Chart
The intraday chart for Abbott Laboratories is not a simple story of a down day; it is a dramatic narrative with a clear plot twist. The session can be effectively split into two distinct parts: a prolonged period of selling pressure followed by a sudden and aggressive reversal.
Part 1: The Morning Decline and Midday Grind (9:30 am – 3:30 pm)
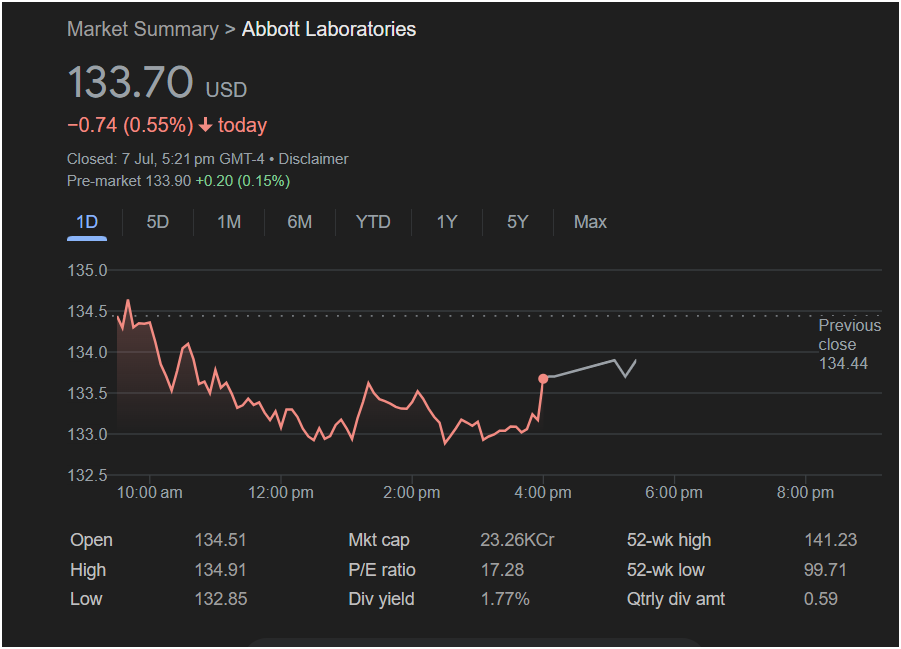
The session began with immediate signs of weakness. Despite a previous close of 134.44 USD, Abbott opened slightly higher at 134.51 USD and briefly touched its high for the day at 134.91 USD. This early peak proved to be unsustainable. Sellers immediately took control, rejecting the higher prices and pushing the stock into a swift decline in the first hour of trading.
This initial sell-off set the tone for the majority of the day. From 10:00 am until approximately 3:30 pm, the stock was in a clear, albeit choppy, downtrend. It ground its way lower, eroding value through the 134 and 133 USD levels. The chart shows a classic “sawtooth” pattern during this period, with small, unconvincing bounces being consistently sold into, leading to a series of lower highs and lower lows. This price action is indicative of a market lacking bullish catalysts, where sellers have the upper hand.
The bearish pressure culminated in the stock hitting its intraday low of 132.85 USD. This marked the point of maximum pessimism for the session, with the stock down more than 1% and showing little sign of recovery.
Part 2: The Closing Hour Reversal (3:30 pm onwards)
The narrative of the day was completely rewritten in the final hour of trading. Just as the stock appeared to be settling near its lows, a massive wave of buying entered the market. The chart depicts a near-perfect “V-shaped” recovery from the 133 USD level. This rally was not a slow drift; it was a sharp, aggressive, and vertical move higher into the 4:00 pm close.
This type of price action is highly significant. A powerful closing rally often indicates institutional buying, where large funds may be accumulating a position, seeing the intraday weakness as an attractive entry point. It suggests that despite the day’s overall negative sentiment, there is strong underlying demand for the stock at these levels. The session closed near the highs of this final rally, a sign of strength that often carries positive momentum into the after-hours session and the following day. The after-hours line chart shows this momentum holding, with some further upward drift.
Section 2: The Bedrock of Stability – A Deep Dive into Abbott’s Financials
The dramatic intraday price action takes place against a backdrop of remarkably stable and attractive fundamental metrics, which helps explain the strong buying interest at the day’s lows.
P/E Ratio: 17.28 – The “Goldilocks” Valuation
Abbott’s Price-to-Earnings (P/E) ratio of 17.28 is arguably its most compelling fundamental metric.
-
Interpretation: This P/E ratio is the hallmark of a mature, reasonably priced company. It is far from the speculative froth of a high-growth stock and equally far from the distressed levels of a company in trouble. It sits below the typical S&P 500 average (often in the 20-25 range), suggesting that the stock is not expensive relative to its earnings.
-
The Investment Thesis: A P/E of 17.28 tells investors that they are paying a fair price for a predictable and high-quality earnings stream. It implies that the market has confidence in Abbott’s business but is not pricing in unrealistic growth expectations. This “Goldilocks” valuation—not too hot, not too cold—provides a margin of safety and makes the stock attractive to a wide array of investors, from cautious individuals to large pension funds.
Dividend Yield: 1.77% – The Mark of a Dividend Aristocrat
Abbott reinforces its blue-chip status with a healthy dividend. Based on a quarterly payout of 0.59 USD (or 2.36 USD annually), the stock offers a dividend yield of 1.77%.
-
Significance: Abbott Laboratories is a famed “Dividend Aristocrat,” a prestigious title for S&P 500 companies that have increased their dividend for at least 25 consecutive years. This long history of rewarding shareholders signals exceptional financial discipline and confidence in long-term cash flow generation. The 1.77% yield provides a steady income stream, making the stock a cornerstone of many retirement and income-focused portfolios. This reliable dividend acts as a powerful support mechanism for the stock price.
52-Week Range (99.71 – 141.23 USD): A Position of Strength
The day’s closing price of 133.70 USD is situated firmly in the upper quartile of its 52-week range. It is trading just 5.3% below its 52-week high of 141.23 USD.
-
Implication: This demonstrates that the stock is in a strong, long-term uptrend. The recent pullback is a minor correction within a much larger bullish structure. Unlike a stock languishing near its lows, Abbott is operating from a position of strength, which likely gave buyers the confidence to step in aggressively during the day’s dip. The 52-week high now serves as the next major resistance target for the bulls.
Market Capitalization: 23.26KCr
The market cap of 23.26KCr (Thousand Crores) translates from the Indian numbering system to 23,260 Crore Rupees. At a standard exchange rate (~83 INR/USD), this equates to a formidable market capitalization of approximately $280 Billion USD.
-
Implication: This places Abbott firmly in the mega-cap category. Its business spans medical devices, diagnostics, nutrition, and branded generic pharmaceuticals, making it a highly diversified and defensive player in the global healthcare landscape. Its massive size and essential product lines provide resilience during periods of economic uncertainty.
Section 3: The Pre-Market Signal – Reinforcing the Reversal
The forward-looking pre-market data adds another layer of optimism to the narrative. The screenshot shows the stock trading at 133.90 USD, a gain of +0.20 (0.15%).
-
Analysis: While the gain itself is small, its importance is magnified by the context. It confirms that the positive momentum from the last-hour rally did not dissipate overnight. It suggests that the buyers from the previous day’s close are still present and that the stock is poised for a positive open, potentially building on the foundation laid by the dramatic V-shaped recovery.
A Resilient Titan Flexes Its Muscles
The 0.55% loss for Abbott Laboratories is a misleading headline. The real story of the day was the powerful tug-of-war between sellers and buyers, a battle that the buyers decisively won in the final, crucial hour of trading. The session was a testament to the stock’s underlying strength and appeal.
Investors witnessed a classic “buy the dip” scenario unfold in real-time, fueled by the company’s fair valuation, its sterling reputation as a Dividend Aristocrat, and its strong long-term market performance. Abbott Laboratories is not a stock defined by speculative frenzy or deep distress; it is a portrait of stability, quality, and resilience. The late-day surge, supported by a positive pre-market signal, suggests that the minor pullback may be over and that the healthcare giant is preparing to challenge its recent highs once again.
Disclaimer: This article is a comprehensive analysis based on the provided screenshot and general market principles. It is intended for informational and educational purposes only and does not constitute financial advice. All investment decisions should be made in consultation with a qualified financial professional.


