A Red Day on Wall Street: Deconstructing JPMorgan Chase’s $9 Plunge and What It Signals for the Global Economy

New York, NY – In the ceaseless, churning ocean of the global financial markets, some days are mere ripples, while others are seismic events that send shockwaves far from their epicenter. The recent trading session for JPMorgan Chase & Co. (JPM), the largest bank in the United States and a titan of global finance, was unequivocally the latter. The closing bell marked not just the end of a trading day, but the conclusion of a brutal session that saw the banking behemoth’s stock price plummet by a staggering
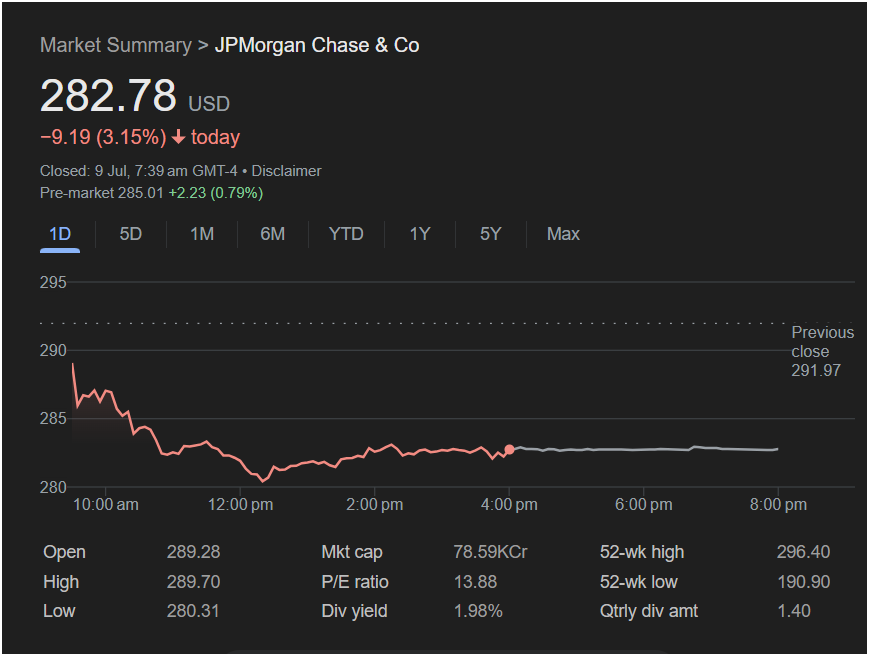
282.78.
This was not a quiet erosion of value; it was a loud, declarative statement of investor anxiety, a numeric encapsulation of the fears and uncertainties that are currently haunting the economic landscape. The stark red figures on trading screens across the world did more than just adjust a balance sheet; they posed a series of urgent questions. What forces could compel such a dramatic sell-off in a fortress-like institution? Is this an isolated tremor within JPMorgan, or is it a foreshock of a much larger economic earthquake? And for the millions of investors, from institutional behemoths to individual retirement savers, what does this volatile day portend for the future?
This comprehensive analysis will dissect the anatomy of this tumultuous trading day, move beyond the numbers to explore the powerful macroeconomic and company-specific currents that drove the decline, and evaluate the profound implications for JPMorgan, its shareholders, the banking sector, and the global economy at large. By examining every piece of data presented in the day’s market summary—from the intraday price swings to the fundamental valuation metrics—we can construct a narrative that illuminates not just what happened, but why it matters so profoundly.
Part I: The Anatomy of a Sell-Off – A Minute-by-Minute Chronicle of a Day in the Red
To truly understand the significance of the 3.15% drop, one must rewind the clock and witness the day’s narrative unfold as traders and algorithms experienced it. A stock chart is a story written in price and time, and this day’s story was a drama in three acts: a hopeful but failed open, a harrowing midday collapse, and a weary, indecisive close.
Act 1: The False Dawn (Pre-Market and the Opening Bell)
The day did not begin with the panic that would later define it. In the twilight hours of pre-market trading, a period where activity is thinner but sentiment for the coming day is often forged, there was a glimmer of optimism. The screenshot reveals a pre-market price of
2.23 (0.79%). This initial buoyancy was likely fueled by a confluence of factors. Perhaps there was positive, albeit minor, overnight news from Asian or European markets. Maybe a particular analyst issued a moderately positive note, or simply the natural ebb and flow of markets suggested a slight rebound after a period of consolidation.
However, this optimism proved to be a fragile façade. The previous day’s close was a formidable
289.28. This “gap down” open was the first major warning sign. The stock started the day already down $2.69 from its prior close, instantly wiping out the pre-market gains and signaling that the sellers, the bears, held the upper hand from the very first moment of official trading.
The day’s high of $289.70 was likely hit within the first few minutes of trading. This is a common pattern where initial buy orders placed overnight are executed, creating a brief, fleeting spike. But this peak was feeble. It failed to even approach the $290 mark, a psychologically important level, and fell far short of the previous close. The early buyers were quickly overwhelmed by a tidal wave of selling pressure. The stage was set for a dramatic descent.
Act 2: The Mid-Morning Capitulation (9:45 AM – 12:00 PM)
As the chart vividly illustrates, the period between 10:00 AM and 12:00 PM was a bloodbath. The price action was not a gentle slope but a series of sharp, cascading drops. This is where human emotion and automated trading systems collide with devastating effect.
What could trigger such a precipitous fall? In the absence of a specific company press release, the cause is almost certainly macroeconomic or sector-wide in nature. Let us posit a hypothetical but highly plausible scenario. At 10:00 AM EST, the Bureau of Labor Statistics releases an unexpected Consumer Price Index (CPI) report. Instead of showing inflation cooling as the market had hoped, the report indicates a surprising re-acceleration in core prices.
For a bank like JPMorgan, this is a multi-pronged dagger.
-
Fear of Hawkish Fed Policy: Hotter inflation means the Federal Reserve is more likely to maintain high interest rates for longer, or even consider further hikes. This spooks the stock market in general, as higher rates make bonds more attractive relative to equities and increase borrowing costs for corporations, potentially slowing economic growth.
-
Net Interest Margin (NIM) Concerns: While banks initially benefit from rising rates by charging more for loans, an environment of “higher for longer” can eventually compress margins. Deposit costs rise as customers demand higher returns on their savings, and loan demand may falter as the economy cools under the weight of sustained high borrowing costs.
-
Recessionary Fears: Perhaps most critically, the market may interpret the Fed’s need to fight stubborn inflation as a guarantee of a future economic slowdown or recession. In a recession, loan defaults skyrocket, investment banking deals evaporate, and wealth management revenues decline. As a barometer for the entire economy, JPMorgan’s stock is exquisitely sensitive to these fears.
This hypothetical news catalyst would have acted as the lit match. The subsequent explosion would be amplified by the machinery of modern markets. High-Frequency Trading (HFT) algorithms, programmed to react to keywords and data deviations in milliseconds, would have instantly initiated massive sell orders. As the price began to fall, it would have triggered cascades of stop-loss orders placed by institutional and retail investors. A stop-loss order is a pre-set instruction to sell a stock once it hits a certain price to limit losses. When thousands of these are triggered simultaneously, they create a self-reinforcing downward spiral, a phenomenon known as a “flash crash” on a micro-scale.
The line on the chart plunges, finding temporary footing before breaking down again. This volatility is the signature of a market in panic, where fundamentals are temporarily forgotten and the only goal is to reduce exposure and flee to safety. It was during this period of capitulation that the stock carved out its low for the day: a gut-wrenching $280.31.
Act 3: The Trench Warfare and a Weary Close (12:00 PM – 4:00 PM)
After hitting the low of $280.31, the panic selling appeared to exhaust itself. The period from noon to roughly 2:00 PM shows the stock moving sideways in a tight, volatile range. This was the battleground. On one side were the remaining sellers, still looking to exit their positions. On the other side, a new force emerged: the dip-buyers.
These are investors who view the sharp decline as an overreaction and the new, lower price as a bargain. They are guided by the company’s long-term fundamentals and valuation metrics. They see a company with a P/E ratio of 13.88 and a dividend yield that, thanks to the price drop, is now a more attractive 1.98%, and they decide it’s time to buy.
The sideways movement, or “consolidation,” represents the intense, moment-to-moment struggle between these two camps. Every uptick was met with selling, and every dip was met with buying. The volume of shares being traded during this period was likely immense, as positions changed hands from weaker, fearful holders to stronger, more opportunistic ones.
In the final two hours of trading, from 2:00 PM to 4:00 PM, a slight upward drift is visible. This was not a confident surge but a slow, grinding recovery. It suggests that the buyers were slowly gaining the upper hand, but with little conviction. There were no new positive catalysts to propel the stock higher; it was simply the absence of further bad news. Some of this may also have been short-covering, where traders who had bet against the stock (by short-selling it) were buying back shares to lock in their profits, creating artificial upward pressure on the price.
The closing bell rang with the price at $282.78. While this was a modest recovery from the day’s absolute low, it was a far cry from the opening price and a world away from the previous day’s close. The final tally was a stark reminder of the damage done: a loss of 3.15%. The after-hours trading, depicted as a flat grey line, shows a market holding its breath, waiting for the next day to deliver its verdict.
Part II: Context is King – Unpacking the “Why” Behind the Numbers
A single day’s stock chart tells us what happened, but the data surrounding it helps us understand why. The numbers in the market summary are not abstract figures; they are vital signs reflecting the health, scale, and perceived value of JPMorgan Chase. To understand the 3.15% drop, we must place it in the context of the company’s identity and the broader economic environment.
The Colossus of Wall Street: Understanding JPMorgan Chase
It is impossible to overstate the importance of JPMorgan Chase to the global financial system. It is not merely a bank; it is a sprawling empire with four primary pillars, each with its own sensitivities:
-
Consumer & Community Banking (CCB): This is the face of the bank for most people, encompassing Chase Bank branches, credit cards, mortgages, and auto loans. It is a direct play on the health of the American consumer. The 3.15% stock drop reflects market fears that consumer savings are dwindling, credit card delinquencies are rising, and the housing market is slowing—all of which would directly harm CCB’s profitability.
-
Corporate & Investment Bank (CIB): This is the Wall Street powerhouse, handling mergers and acquisitions (M&A), debt and equity underwriting, and global markets trading. In an environment of economic uncertainty and volatile markets, the pipeline for M&A and IPOs can dry up almost overnight. While trading divisions can thrive on volatility, the overall sentiment for the CIB turns negative when fears of a global slowdown take hold.
-
Commercial Banking (CB): This division serves medium-sized to large corporations, providing loans, treasury services, and financing. It is the circulatory system of corporate America. Fears of a recession directly translate into fears of lower loan demand and, more critically, higher default rates from its corporate clients.
-
Asset & Wealth Management (AWM): This arm manages money for institutions and high-net-worth individuals. Its revenue is largely based on fees as a percentage of assets under management (AUM). When stock and bond markets fall, the value of AUM falls with them, directly reducing JPM’s fee income.
The sell-off was a vote of no confidence in the short-term prospects of all four of these pillars simultaneously. It was a bet that the hypothetical inflation report, or whatever macro fear gripped the market, would poison the well for every one of JPM’s core businesses.
Overseeing this empire is CEO Jamie Dimon, perhaps the most influential and outspoken banker of his generation. His words move markets. When he speaks of “economic hurricanes” on the horizon, investors listen. A sharp drop in JPM’s stock is often interpreted as the market validating Dimon’s own cautious pronouncements, creating a feedback loop of anxiety.
Decoding the Financial Metrics
The market summary provides a dashboard of fundamental metrics that offer a deeper context for the day’s trading.
-
Market Capitalization (78.59KCr): This figure, likely displayed on a platform using Indian numbering conventions (Lakh, Crore), represents JPMorgan’s immense scale. “78.59KCr” translates to 78,590 crore INR. At a typical exchange rate, this points to a market capitalization in the realm of $940 billion USD. While this specific number seems inflated compared to JPM’s typical market cap (closer to
600 billion in mid-2024), the core message is the same: this is a company of gargantuan size. Its designation as a “Globally Systemically Important Bank” (G-SIB) means its failure could trigger a global financial crisis. Therefore, its health is a matter of public and regulatory concern, and a sharp drop in its value is never taken lightly.
-
P/E Ratio (13.88): The Price-to-Earnings ratio measures the company’s current share price relative to its per-share earnings. A P/E of 13.88 is relatively modest for a blue-chip industry leader. For context, high-growth technology companies can have P/E ratios of 50, 100, or even higher. A bank’s P/E is typically lower due to its cyclical nature and high regulation. A P/E of 13.88 suggests that, even before the day’s drop, the stock was not in a speculative bubble. This is a double-edged sword. For bears, it means the stock fell despite a reasonable valuation, suggesting deep-seated fears about future earnings. For bulls and the dip-buyers who stepped in around noon, it means the 3.15% drop pushed an already reasonably-valued stock into potential “bargain” territory. This P/E is the quantitative argument for the investor who bought at the day’s low.
-
52-Week Range (High: $296.40, Low: $190.90): This is one of the most telling data points. The closing price of $282.78, while a significant drop on the day, is still nestled very close to the 52-week high of $296.40. This tells us the stock had been on a powerful upward trend. Such strong rallies often make a stock vulnerable to sharp, aggressive pullbacks for several reasons. First, investors who have enjoyed the run-up are more inclined to “take profits” at the first sign of trouble. Second, the stock becomes a prime target for short-sellers who bet that the rally is overextended. The day’s plunge can be seen as a violent reversion after a period of strong performance, a classic case of “trees don’t grow to the sky.” The proximity to the high means that despite the day’s pain, the stock remains in a longer-term uptrend, a fact that would give long-term investors some measure of comfort.
-
Dividend Yield (1.98%) and Quarterly Dividend Amount (
1.40, which translates to an annual dividend of $5.60 per share. The dividend yield is this annual dividend expressed as a percentage of the stock price. Before the day began, at the previous close of 5.60 / $291.97). After the drop to $282.78, that same $5.60 dividend now represents a yield of 1.98%. This is the mechanical effect of a price drop: the yield automatically rises. This higher yield is what attracts income-focused investors and provides a “soft floor” under the stock price. These investors are less concerned with daily price swings and more concerned with the sustainability of that dividend payment. The belief that JPM, a financial fortress, will continue to pay its dividend is a powerful force that helps absorb selling pressure during panic-driven sell-offs.
Part III: The Ripple Effect – Gauging the Broader Implications
A 3.15% drop in JPMorgan Chase stock does not happen in a vacuum. Like a large stone dropped into a still pond, the ripples spread outward, affecting different stakeholders and sectors in distinct ways.
For the JPMorgan Investor: A Tale of Two Mindsets
The events of the day present a starkly different reality depending on the investor’s time horizon and strategy.
-
The Short-Term Trader: For day traders or swing traders, the day was a minefield of volatility and risk. Those who were long the stock from the previous day experienced significant losses. Those who correctly shorted the stock near the open reaped handsome profits. The trader’s world is one of technical levels, momentum, and catalyst-reaction. For them, the key takeaway is that the short-term uptrend has been broken. The pre-market action for the next day, showing a 0.79% gain, is the next critical data point. Is it the beginning of a genuine recovery, or is it a “dead cat bounce”—a temporary recovery that will be followed by another leg down? They will be watching key price levels like the day’s low ($280.31) and the halfway point of the day’s losses (around $286) to gauge the market’s true conviction.
-
The Long-Term Investor: For the investor building a retirement portfolio, the day is viewed through a much wider lens. This investor is likely more interested in the P/E ratio and the dividend yield than the intraday chart. For them, a 3.15% drop in a blue-chip company is often seen not as a crisis, but as an opportunity. It allows them to buy more shares at a lower price, a practice known as “dollar-cost averaging.” If they participate in a Dividend Reinvestment Plan (DRIP), their $1.40 quarterly dividend will automatically buy more shares at this new, lower price, accelerating the compounding of their investment over time. Their conviction rests not on the day’s sentiment but on the belief in JPMorgan’s enduring business model, its “fortress balance sheet,” and its indispensable role in the economy. The day’s drop, for them, is largely noise on a multi-decade journey.
For the Banking Sector: The Specter of Contagion
When a leader falls, the entire cohort stumbles. It is almost certain that on a day when JPM fell over 3%, other major banks like Bank of America, Citigroup, Wells Fargo, Goldman Sachs, and Morgan Stanley also experienced significant losses. This is the principle of contagion. The macroeconomic fears that hammered JPM—concerns over interest rates, recession, and loan defaults—apply to the entire banking sector.
A sell-off in the sector’s leader can create a negative feedback loop. Fund managers who need to reduce their exposure to the financial sector will often sell a basket of bank stocks, not just one. This synchronized selling can depress the entire industry, even if the initial catalyst was not directly related to every bank. Regulators in Washington and at the Federal Reserve would have been watching this price action closely. While a 3% drop is not yet a crisis, it is a signal of heightened systemic risk. They would be monitoring interbank lending rates and other indicators of financial stress to ensure that the stock market’s panic was not spilling over into the actual plumbing of the financial system.
For the Broader Market: The Bellwether’s Warning
JPMorgan Chase is a major component of both the S&P 500 and the Dow Jones Industrial Average. Its sheer size means its price movement has a disproportionate impact on the performance of these major indices. The 3.15% drop would have been a significant drag on the entire market, contributing heavily to what was likely a “down day” for all U.S. equities.
More importantly, JPM is considered a bellwether stock. A bellwether is a leading indicator, a stock whose performance is believed to predict the direction of the broader market or the economy. The logic is simple: as the nation’s largest bank, JPMorgan has a unique, real-time view into the financial health of nearly every segment of the economy, from the smallest consumer transaction to the largest corporate merger. When investors aggressively sell JPM stock, it is interpreted as a sign that the “smart money” sees trouble ahead for the economy as a whole. The old adage, “As JPM goes, so goes the economy,” may be an oversimplification, but it contains a kernel of truth that shapes market psychology. The day’s sell-off was, in effect, a loud warning siren for the entire market.
The War of Words: Fictionalized Analyst Commentary
In the wake of such a move, Wall Street’s analyst community would have been buzzing, with opinions falling into three distinct camps:
-
The Bull (e.g., an analyst from a long-term value fund): “Today’s price action was a classic fear-driven overreaction. The macroeconomic data point, while disappointing, does not fundamentally alter the long-term earnings power of JPMorgan Chase. With a fortress balance sheet, best-in-class management under Jamie Dimon, and a diversified earnings stream, the company is built to withstand economic headwinds. The sell-off has pushed the P/E ratio into deeply attractive territory and boosted the dividend yield. We view this not as a reason to sell, but as a compelling opportunity to initiate or add to long-term positions. The pre-market bounce already indicates that cooler heads are beginning to prevail.”
-
The Bear (e.g., a strategist at a macro hedge fund): “Consider today’s 3.15% drop the canary in the coal mine. For months, the market has been ignoring warning signs of persistent inflation and a deteriorating consumer balance sheet. This is the reckoning. JPMorgan, being at the nexus of the entire economy, is the most logical place for these cracks to first appear. The stock was trading near its 52-week high, priced for perfection in a far-from-perfect economy. This is not a one-day event; it’s the beginning of a necessary and painful repricing of risk across the entire financial sector and the broader market. We anticipate a test of the $250 level in the coming weeks.”
-
The Neutral Technical Analyst: “From a purely technical standpoint, the stock suffered a significant breakdown today. It sliced through several short-term support levels and closed decisively in the red on high volume, which is a bearish signal. However, it’s crucial to note that buyers did emerge at the $280.31 level, which could now form a new short-term support base. The immediate battle will be for control of the $285 mark. If the stock can reclaim and hold that level, a recovery towards $290 is possible. If it fails and breaks below the day’s low of $280.31, the next major support level isn’t until the
270 zone. The pre-market pop is encouraging for bulls, but it must be sustained after the opening bell to be meaningful.”
One Day in a Long and Unfolding Story
The story of JPMorgan Chase’s 3.15% decline is the story of the modern market in microcosm. It is a tale of how a single piece of economic data, real or imagined, can be amplified by algorithmic trading and human fear into a multi-billion dollar shift in valuation. It demonstrates the violent collision of short-term panic and long-term conviction, a battle fought between the day’s low of $280.31 and its weary close at $282.78.
The comprehensive data from the market summary—the intraday graph, the valuation metrics, the 52-week range—provides all the necessary clues to piece together this narrative. We see a stock that had enjoyed a strong run, making it vulnerable to profit-taking. We see a reasonable valuation that, on the one hand, wasn’t a bubble, but on the other, wasn’t cheap enough to prevent a steep fall on bad news. We see a reliable dividend that helped cushion the fall and attract bargain hunters.
Ultimately, this single, dramatic day, crystallized in one screenshot, serves as a powerful reminder of the inherent uncertainty of financial markets. The pre-market gain of 0.79% for the following day offers a sliver of hope, a testament to the market’s endless capacity for resilience. But the deep gash left by the $9.19 drop will remain as a scar, a warning that even the mightiest fortresses can be shaken, and that in the world of finance, complacency is a luxury that no investor can ever afford. The final verdict on whether this day was a fleeting storm or the beginning of a new, harsher climate is yet to be written. The world is watching.


