
NEW YORK, NY – T-Mobile Us Inc. (NASDAQ: TMUS), a dominant force in the U.S. wireless industry, experienced a significant pullback in its latest trading session, closing at 237.63 USD. The stock shed -3.12 points, marking a 1.30% decline and reflecting a day controlled by bearish sentiment. The downward momentum appears poised to continue, with pre-market indicators pointing to further losses, raising concerns among investors about the stock’s near-term stability.
This comprehensive analysis will delve into every nuance of the trading day, meticulously dissecting the intraday price action and the fundamental metrics provided. We will explore the story told by the numbers, contextualize T-Mobile’s position within its 52-week range, and interpret what the pre-market activity could portend for the telecommunications giant.
 Section 1: The Narrative of the Trading Day – A Chronicle of a Slow Bleed
The provided intraday chart offers a granular view of a session characterized not by a single dramatic plunge, but by a persistent and grinding downward pressure that ultimately wore down any bullish resolve.
The Open and the Immediate Test of Resistance:
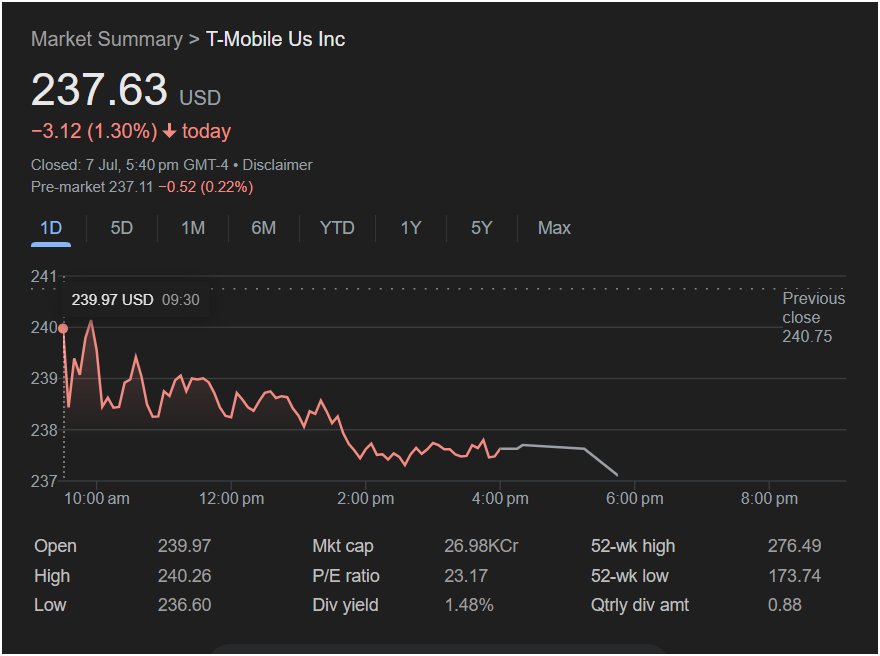
The day began on a sour note. After finishing the previous session at 240.75 USD, T-Mobile opened slightly lower at 239.97 USD. This immediate “gap down” was an early warning sign. In the first thirty minutes of trading, the stock saw a flurry of activity, pushing to its high of the day at 240.26 USD. This moment was the most critical juncture of the session. The stock’s inability to decisively reclaim the 240.75 previous close level served as a powerful rejection. This failure to attract follow-through buying at such a key psychological and technical level effectively opened the door for sellers to take command. The annotation on the chart, “239.97 USD 09:30,” pinpoints this crucial opening period where the day’s downward trajectory was established.
The Midday Grind (10:00 am – 1:30 pm): A Battle of Attrition
Following the opening rejection, the stock did not collapse but rather entered a “slow bleed.” The chart from 10:00 am to about 1:30 pm displays a classic bearish channel, characterized by a series of lower highs and lower lows. The price action was choppy and volatile, oscillating in a jagged pattern as it slid from the 239 USD level down towards 238 USD. This pattern suggests a protracted struggle. While there were intermittent buying attempts that caused small upward spikes, each was met with renewed selling pressure at a slightly lower level than before. This indicates that sellers were consistently in control, methodically pushing the price down rather than triggering a panic sell-off.
The Afternoon Acceleration and Capitulation (1:30 pm – Close):
The gradual decline gave way to a more pronounced drop in the early afternoon. Around 1:30 pm, the stock decisively broke below the 238 USD support level, accelerating its descent. It was during this phase that the stock reached its intraday low of 236.60 USD. This move represented the final capitulation of the day’s buyers.
From about 3:30 pm onwards, the stock entered a consolidation phase, finding a temporary floor just above its daily low. The price line flattens out, indicating that the bulk of the selling was over as the market prepared for the close. The session officially concluded with the stock settling at 237.63 USD. The chart extends to show the after-hours trading, where the price drifts slightly lower, underscoring the lingering negative sentiment.
Section 2: A Deep Dive into the Financial Dashboard
The numbers below the chart provide the essential context for evaluating T-Mobile’s current market standing and valuation. They tell a story of a healthy, growing company that is currently facing market headwinds.
The 52-Week Range (173.74 – 276.49 USD): Navigating the Upper Echelon
T-Mobile’s stock, at 237.63 USD, is positioned firmly in the upper half of its 52-week range. It is trading approximately 14% below its 52-week high of 276.49 USD, but still a healthy 37% above its 52-week low of 173.74 USD.
-
Interpretation: This positioning is distinct from a stock in a clear crisis (near its lows) or one at a euphoric peak (near its highs). It suggests that T-Mobile has enjoyed a strong run over the past year but is now in a period of consolidation or correction. The uptrend has stalled, and the stock is now in a wide trading range. Investors who bought in at lower prices may be taking profits, while new investors are hesitant to chase the stock higher, creating the current selling pressure. The previous high of 276.49 now stands as a significant long-term resistance level.
P/E Ratio: 23.17 – A Picture of Rational Growth
The Price-to-Earnings (P/E) ratio of 23.17 is a cornerstone of T-Mobile’s valuation story.
-
Analysis: This P/E multiple is neither excessively high nor cheaply valued. It sits comfortably in a range that is often considered reasonable for a stable company with solid growth prospects, roughly in line with the historical average of the S&P 500. It suggests that the market is not pricing in speculative, explosive growth (like a high-flying tech stock) nor is it anticipating a collapse in earnings (like a deeply distressed company). Instead, it reflects expectations of steady, continued growth in earnings and cash flow, which is consistent with T-Mobile’s market position as a leader in the mature telecommunications industry. This valuation provides a degree of stability, as it is less likely to suffer the violent swings associated with more extreme P/E ratios.
Dividend Data: Yield of 1.48% and Quarterly Amount of 0.88 USD
T-Mobile offers a quarterly dividend of 0.88 USD, which annualizes to 3.52 USD per share. This results in a dividend yield of 1.48% at the current price.
-
Significance: For years, T-Mobile was known purely as a growth stock, reinvesting all its cash back into the business to fuel its “Un-carrier” revolution and network expansion. The initiation and growth of a dividend marks a significant strategic pivot towards becoming a more mature company that also returns capital directly to shareholders. While the 1.48% yield is modest and not the primary reason to own the stock, it provides a small income stream and signals management’s confidence in the stability and predictability of its future cash flows. It broadens the stock’s appeal to a wider range of investors, including those with an income focus.
Market Capitalization: 26.98KCr
Using the Indian numbering system conversion, 26.98KCr (Thousand Crores) equates to 26,980 Crore Rupees. At a standard exchange rate (e.g., ~83 INR/USD), this calculates to a market capitalization of roughly $325 billion USD.
-
Implication: This valuation solidifies T-Mobile’s status as a large-cap behemoth. It is one of the three major players in the U.S. wireless oligopoly, a position that affords it significant scale, brand recognition, and a massive subscriber base. This large size provides a degree of defensiveness but also means that growing the business requires substantial market share gains or the creation of new revenue streams.
Section 3: The Pre-Market Omen – A Bearish Continuation
The most forward-looking data point on the screenshot is the pre-market activity, and its message is unambiguous. The stock is indicated at 237.11 USD, down another -0.52 points (0.22%) from its close.
-
Analysis: Unlike a pre-market bounce that suggests a “buy the dip” mentality, this negative reading indicates that the selling pressure from the previous session is carrying over. It is a bearish continuation signal. It suggests that sentiment remains negative and that the stock is likely to open the next official trading session lower, potentially re-testing or even breaking below the previous day’s low of 236.60. This is a significant red flag for any investor hoping for an immediate reversal.
A Resilient Giant Facing Near-Term Headwinds
T-Mobile’s trading session encapsulates the dilemma of a strong company facing a weak market tape. The underlying business is mature and profitable, the valuation is reasonable, and shareholder returns are growing. However, the technical picture is undeniably weak. The stock was rejected at a key resistance level and bled lower throughout the day, a trend that the pre-market data suggests will continue.
The company is not in distress, but its stock is clearly under pressure. Investors are now forced to weigh the solid long-term fundamentals against the negative short-term momentum. The key level to watch will be the previous day’s low of 236.60 USD. A hold and bounce from that level could signal the start of a new support base, but a definitive break below it could open the door for a deeper correction towards the middle of its 52-week range. The battle between T-Mobile’s fundamental strength and the market’s current bearish sentiment is set to intensify.
Disclaimer: This article is an in-depth analysis based solely on the provided screenshot and general principles of market analysis. It is intended for informational purposes and should not be construed as financial advice. All investment decisions should be made in consultation with a qualified financial professional.


