UnitedHealth Group Under Pressure: A Deep Dive into a Stock Grappling with Bearish Momentum Near 52-Week Lows

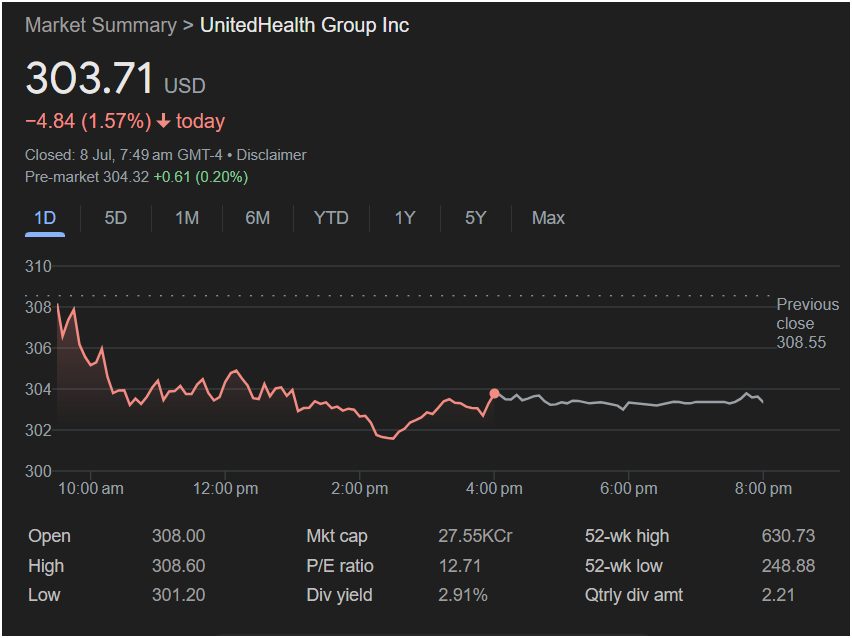
NEW YORK, NY – UnitedHealth Group Inc. (NYSE: UNH), a titan of the American healthcare industry and a Dow Jones Industrial Average component, faced another challenging trading session, with its stock closing at 303.71 USD. The decline of -4.84 points, a significant 1.57% drop, has pushed the bellwether stock uncomfortably close to its 52-week low, fueling a tense debate among investors about its future trajectory.
While a modest pre-market uptick offers a sliver of hope, the day’s trading activity and the broader context painted by its valuation metrics reveal a company at a critical crossroads. The stock’s performance is a classic case study in the conflict between bearish market sentiment and seemingly attractive fundamental value. This exhaustive analysis will dissect every available data point from the trading day to understand the forces at play, the risks on the horizon, and the potential opportunities that may be emerging from the turmoil.
 Section 1: The Anatomy of a Bearish Trading Day – A Blow-by-Blow Account
The intraday stock chart is a narrative written in price action, telling the story of a battle between buyers and sellers. For UnitedHealth, the story of this day was one of sustained bearish control, punctuated by periods of indecision and failed recovery attempts.
The Opening Bell: A Gap Down and Immediate Rejection
The session was doomed from the start. Coming off a previous close of 308.55 USD, the stock opened the day lower at 308.00 USD. While not a massive gap down, this initial weakness set a negative tone. In the first few minutes of trading, the stock made a feeble attempt to rally, marking its high for the day at 308.60 USD. This moment is critically important: the stock barely managed to poke its head above the previous day’s close before being decisively rejected. This failure to attract buyers at a key price level signaled a profound lack of bullish conviction and immediately handed the momentum to sellers.
Following this rejection, the selling pressure intensified. In the first hour of trading, from approximately 9:30 am to 10:30 am, the chart shows a steep descent. The stock sliced through the 308, 306, and 304 USD levels in a cascade of selling, establishing a clear and aggressive downward trend for the day.
The Midday Quagmire (10:30 am – 2:30 pm): A Tense Stalemate
After the initial morning plunge, the stock entered a prolonged period of sideways, choppy trading, oscillating primarily within a two-dollar range between 302.50 and 304.50 USD. This four-hour period represents a market in search of direction.
-
The Bull Case During this Period: Buyers who viewed the morning drop as excessive likely stepped in, establishing a temporary floor of support. They were able to halt the freefall, but their efforts were insufficient to spark any meaningful recovery.
-
The Bear Case During this Period: Sellers, having profited from the morning drop, were likely defending the 304-305 USD level, selling into any minor rally and preventing the stock from reclaiming its losses.
This “consolidation phase” is often a prelude to the next significant move. The jagged, sawtooth pattern indicates high-frequency trading and a tug-of-war between institutional buyers and sellers, with neither side able to gain a decisive advantage.
The Afternoon Breakdown: The Bears Win the Day
The stalemate was broken shortly after 2:30 pm. The stock broke below the support of its midday range, initiating a second, albeit less severe, leg down. This move is significant because it shows that the bearish pressure ultimately overwhelmed the midday buying support. It was during this phase that the stock printed its low for the day at 301.20 USD. This new low confirmed that sellers remained in firm control of the session’s narrative.
A minor bounce off this absolute low in the final hour of trading brought the stock back above the 303 USD mark, leading to its final closing price of 303.71 USD. This late-day activity suggests some bargain-hunting or short-covering into the close, but it did little to repair the technical damage inflicted throughout the day.
Section 2: The Bigger Picture – A Forensic Analysis of Key Metrics
The daily price action is just one chapter in a much larger story. The financial dashboard provides the essential context, revealing a narrative of long-term struggle combined with compelling valuation arguments.
The 52-Week Range (248.88 – 630.73 USD): A Story of Severe Underperformance
This is the single most important data point for understanding UnitedHealth’s current predicament. The stock is trading at 303.71 USD, a staggering 52% below its 52-week high of 630.73 USD. In stark contrast to a stock near its peak, UNH is clearly in a protracted, long-term downtrend. It is sitting just 22% above its 52-week low of 248.88 USD.
-
Implication 1: Deep-Seated Concerns. A decline of this magnitude is not the result of simple profit-taking. It points to persistent, fundamental concerns about the company or its industry. These could include rising medical cost trends (which squeeze insurer margins), regulatory risks from the government, increased competition, or fears of an economic slowdown impacting healthcare spending.
-
Implication 2: Negative Investor Sentiment. The trend is the investor’s friend, and for UNH, that trend has been decisively negative for many months. The stock is “technically damaged,” and many trend-following funds and investors would be avoiding it or holding short positions. The 52-week low of 248.88 USD now looms as a critical psychological and technical support level.
P/E Ratio: 12.71 – The Value Investor’s Dilemma
Herein lies the central conflict of the UnitedHealth story. A Price-to-Earnings (P/E) ratio of 12.71 is extraordinarily low for a blue-chip market leader. For context, the broader S&P 500 index often trades at a P/E multiple between 20 and 25.
-
The Bullish Interpretation (The “Value Play”): A low P/E suggests the stock is cheap relative to its current earnings. Proponents would argue that the market has overly punished the stock and is failing to appreciate its stable, massive cash flows and dominant market position. They see this as a buying opportunity, believing the company’s earnings power will prove resilient.
-
The Bearish Interpretation (The “Value Trap”): Skeptics argue that the market is not stupid; the P/E is low for a reason. They believe the “E” (Earnings) in the P/E ratio is set to decline significantly in the future. If earnings fall, today’s “low” P/E will quickly look expensive. The persistent price decline suggests that, right now, the market is voting for the “value trap” scenario.
Dividend Yield: 2.91% and Quarterly Dividend: 2.21 USD – The Income Safety Net
UnitedHealth pays a robust quarterly dividend of 2.21 USD per share, which translates to 8.84 USD annually. At the current price, this gives the stock an attractive dividend yield of 2.91%.
-
Significance: This is a substantial yield that provides a powerful incentive for long-term, income-oriented investors. It acts as a “paid-to-wait” mechanism; even if the stock price stagnates, investors are still earning a nearly 3% return. This dividend provides a floor of support for the stock, as a further price decline would push the yield even higher, making it more attractive to yield-seeking funds.
-
A Sign of Financial Health: A company’s ability to pay a consistent and growing dividend is one of a strongest signals of its underlying financial health and management’s confidence in future cash flows. Despite the stock’s poor performance, this metric suggests the core business remains a cash-generating machine.
Market Capitalization: 27.55KCr
Using the same Indian numbering system conversion (1 KCr = 10 billion Rupees), 27.55KCr translates to 27,550 Crore Rupees. At a typical exchange rate (~83 INR/USD), this equates to a market capitalization of approximately $332 billion USD.
-
Implication: UNH is a behemoth. Its massive scale makes it a bellwether for the entire U.S. healthcare sector. Its struggles are likely reflective of, and contributing to, weakness across the industry. As a core holding in countless pension funds, ETFs, and mutual funds, its poor performance has wide-ranging impacts on the market.
Section 3: Interpreting the Pre-Market Signal
The final piece of the puzzle is the pre-market data: a gain of +0.61 points (0.20%) to 304.32 USD.
-
Analysis: This is an exceptionally weak and unconvincing rebound. A 0.20% gain barely registers after a 1.57% loss. It suggests that while the aggressive selling may have paused, there is no rush of enthusiastic buyers stepping in. It’s more indicative of a pause or stabilization rather than a genuine reversal of sentiment. Unlike a strong pre-market rally that signals a “buy the dip” consensus, this tepid move suggests deep-seated uncertainty and a “wait and see” approach from the market.
A Titan on Unsteady Ground
UnitedHealth Group’s stock presents a fascinating and deeply conflicted picture. On one hand, you have the unmistakable evidence of a brutal, long-term downtrend, with the price languishing near its yearly lows. The daily price action confirms that sellers remain in control. This is the market screaming that there are significant headwinds and risks ahead.
On the other hand, the fundamental valuation metrics cry “value.” A P/E ratio of 12.71 combined with a nearly 3% dividend yield is a classic recipe for a value investment. These numbers suggest a financially robust company whose stock may have been oversold.
The ultimate question for investors is which narrative will prevail. Is UnitedHealth a “value trap,” a falling knife whose low valuation is a warning of declining future earnings? Or is it a generational buying opportunity to acquire a market-leading blue-chip at a discount? The stock is currently caught in the crossfire of this debate. Its proximity to the crucial 52-week low of 248.88 USD makes the current price level a critical battleground. A firm bounce from this area could signal the beginning of a bottoming process, while a break below it could usher in the next painful chapter of its decline.


