T-Mobile Stock Slumps Over 1%, Closing at $237.63 in Broad-Based Sell-Off; Pre-Market Data Signals Further Investor Anxiety

BELLEVUE, Wash. – Shares of telecommunications giant T-Mobile Us Inc (NASDAQ: TMUS) faced a significant setback in the latest trading session, succumbing to persistent selling pressure that pushed the stock down by over a percentage point. The company, a key player in the 5G revolution, closed the day at
3.12, or 1.30%. The bearish sentiment is threatening to spill over into the next session, with pre-market trading indicating another leg down, raising concerns among investors about the stock’s short-term trajectory.
The trading day for T-Mobile was a clear victory for the bears, as the stock failed to find solid footing from the opening bell to the close. This in-depth analysis will chronicle the day’s turbulent price action, dissect the critical financial metrics underpinning the stock’s current valuation, and place this single day’s performance into a broader, more meaningful context for the market.
A Session Dominated by Sellers: Unpacking the Day’s Trading Narrative
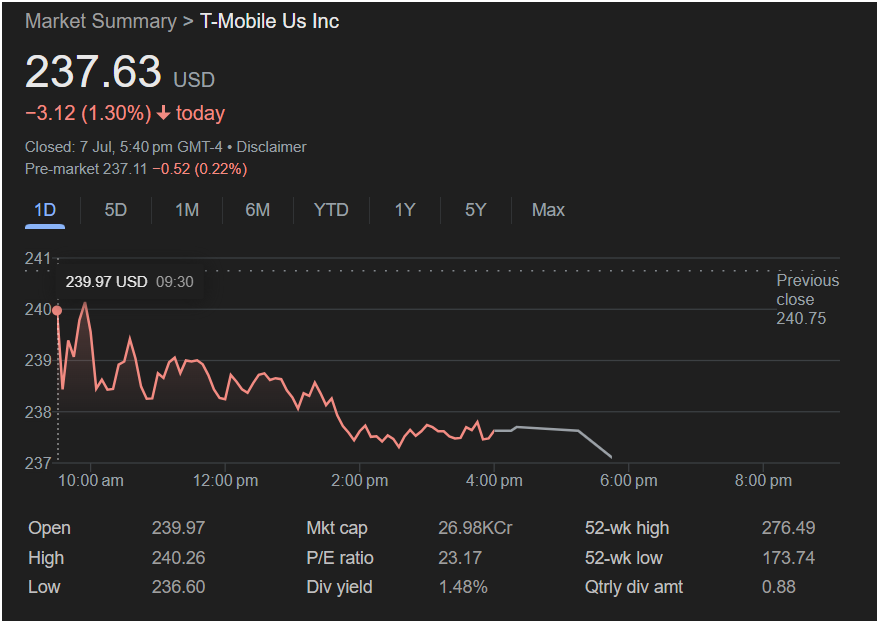
The story of T-Mobile’s trading day, as detailed in the 1D chart, is one of a downward trend that began at the very start of the session. The stock’s opening price was $239.97. Crucially, this was already significantly lower than the previous day’s close of $240.75. This “gap down” opening was the first red flag, indicating that overnight news or a shift in broad market sentiment had already put T-Mobile on the defensive before regular trading even commenced. The price point of $239.97 at 09:30 AM, captured on the chart, coincides exactly with the open, marking the high-water mark from which the stock would retreat.
Shortly after the open, the stock made a feeble attempt to rally, reaching its intraday high of $240.26. This peak is critically important for two reasons. First, it represents the moment of maximum bullish strength for the day. Second, and more tellingly, it failed to surpass the previous closing price of $240.75. In technical analysis, when a stock cannot reclaim the prior day’s close, that level acts as a powerful psychological and technical resistance. This failure confirmed that sellers were in firm control.
From that modest peak, the trajectory was almost exclusively downward. The chart shows a consistent, grinding decline through the morning and into the early afternoon. Unlike a sudden panic-driven crash, this was a methodical sell-off, suggesting a sustained lack of buying interest and a steady stream of sellers liquidating their positions. The stock slid through the $239 and $238 levels, eventually finding its nadir for the day.
The session’s low was struck at $236.60. This price represents the point of maximum pessimism, where the selling pressure finally exhausted itself and buyers began to see value, establishing a floor for the day. For the remainder of the afternoon, the stock entered a period of consolidation. The chart shows the price line flattening out and trading in a narrow range around the $237.50 mark before a final dip into the close.
The stock ultimately closed at $237.63, well off its lows but still cementing a decisive loss. The closing price, captured on July 7th at 5:40 PM GMT-4, reflects a market that has punished the stock but found a tentative equilibrium ahead of the next session.
Shadows into the Next Session: The Pre-Market Warning
The screenshot provides a vital look ahead with its pre-market data. In after-hours or early morning trading, T-Mobile shares were quoted at
0.52 (0.22%) from the official close.
Pre-market trading is a crucial barometer of investor sentiment leading into the next market open. This negative figure suggests that the bearish momentum has not yet dissipated. It signals that T-Mobile is likely to open the next trading day under pressure, immediately putting the previous session’s low of $236.60 in focus as a critical support level. A breach of this level could signal to traders that a deeper price correction is underway.
The Fundamental Picture: A Deeper Look at T-Mobile’s Valuation
Beyond the red ink of a single day’s trading, the provided financial metrics offer a more holistic view of T-Mobile’s market standing and investment thesis.
-
Market Capitalization (26.98KCr): This figure, displayed in the Indian numbering system of “Thousand Crores,” translates to an immense market value of approximately $269.8 billion. This places T-Mobile firmly in the “mega-cap” echelon, alongside the largest and most influential companies in the world. Its size reflects its dominant position in the U.S. wireless industry.
-
P/E Ratio (23.17): T-Mobile’s Price-to-Earnings ratio of 23.17 is a key valuation metric. It indicates that the market is willing to pay over $23 for each dollar of the company’s current annual earnings. For a mature telecommunications company, this is a relatively robust P/E ratio. It suggests that investors are not just valuing T-Mobile on its current profits but are pricing in significant future growth, likely tied to its leadership in the 5G network rollout and its ability to continue capturing market share.
-
Dividend Analysis (1.48% Yield,
0.88 per share. While not as high as some “value” stocks, this dividend is a significant part of the total return proposition. It provides a steady income stream to shareholders and signals the management’s confidence in stable, long-term cash flow generation. For a company still considered to be in a high-growth phase, a dividend payment adds a layer of appeal for more conservative, income-oriented investors.
-
52-Week Range ($173.74 – $276.49): This year-long trading range provides essential context. The current closing price of $237.63 sits squarely in the upper half of this range. While the stock is down nearly 15% from its 52-week high of $276.49, it remains a staggering 37% above its 52-week low of $173.74. This wider view shows that despite the recent downturn, the stock has been in a powerful long-term uptrend. The current weakness could be interpreted by bulls as a natural and healthy pullback within a larger bullish structure.
A Crossroads for a Market Leader
The performance of T-Mobile Us Inc. on this day presents a classic market crossroads. The short-term picture is unequivocally bearish. The significant daily loss, the failure to overcome initial resistance, the steady intraday decline, and the negative pre-market data all point towards continued volatility and potential for further downside.
However, the long-term fundamental and technical picture remains much stronger. The company’s massive market cap, growth-oriented valuation, shareholder-friendly dividend, and strong performance over the past year form the bedrock of a compelling bullish argument.
Investors and market analysts will now be intensely focused on the key technical levels. Can the stock hold support at the session low of
240.75 level would be the first sign that the bulls are wrestling back control. The outcome of this struggle will likely define T-Mobile’s stock performance in the immediate future.


