
NEW YORK, NY – In a trading session marked by significant volatility and investor indecision, Oracle Corporation (NYSE: ORCL) saw its shares retreat from near-record highs, painting a complex picture of a technology titan grappling with market pressures. The stock closed the day at 232.26 USD, a notable decline of -5.06 points, representing a 2.13% loss. This downturn occurred just as the company was flirting with its 52-week zenith, raising critical questions among investors about whether this is a temporary pullback or the beginning of a more sustained correction. However, a robust pre-market rally is already signaling a potential clawback, adding another layer of intrigue to Oracle’s immediate future.
This in-depth analysis will deconstruct every facet of the day’s trading, examine the underlying metrics presented in the snapshot, and explore the potential narratives that could be driving Oracle’s stock performance.
 Section 1: The Narrative of the Trading Day – A Minute-by-Minute Breakdown
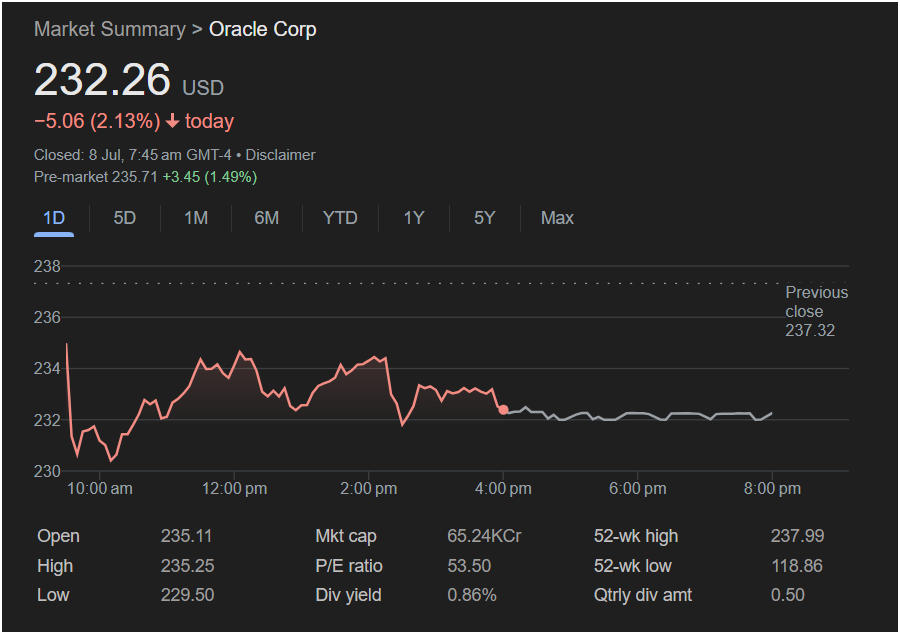
To truly understand the 2.13% decline, we must look beyond the closing number and analyze the intraday journey of the stock price, as depicted in the provided line graph. The chart, which spans from just before 10:00 am to 8:00 pm, tells a story of early-session weakness, a midday struggle for recovery, and a late-afternoon fade into a consolidated close.
The Opening Bell and Initial Plunge:
The session began on a negative footing. With a previous close of 237.32 USD, the market opened with Oracle already down, starting the day at 235.11 USD. This “gap down” opening immediately signaled bearish sentiment carrying over from the previous close or developing in the pre-market hours. Following the open, there was a brief and feeble attempt at a rally, which saw the stock reach its daily high of 235.25 USD. This peak, achieved in the opening minutes, was telling; it was significantly below the previous day’s close, indicating a lack of buying power to even challenge that key resistance level.
The failure to push higher was met with an immediate and aggressive wave of selling. Between 10:00 am and approximately 10:30 am, the stock entered a steep decline, plummeting through the 234, 232, and 230 USD levels to ultimately bottom out at its daily low of 229.50 USD. This sharp drop represents a 5.75-point swing from its high to its low, a considerable range that underscores the day’s volatility. This initial hour of trading set a decidedly negative tone for the rest of the session.
The Midday Battle for Stability (11:00 am – 2:00 pm):
After hitting the floor at 229.50 USD, a period of stabilization and attempted recovery ensued. Buyers stepped in, likely viewing the sharp drop as an overreaction or a potential entry point. The chart shows a classic “sawtooth” pattern during this period, with the stock fighting its way back up. It reclaimed the 232 USD level and then the 234 USD level, peaking around 12:00 pm just below 235 USD.
This midday rally was crucial. It demonstrated that there was still underlying support for the stock and that not all market participants were bearish. However, this recovery lacked the conviction to break through the initial opening high. For the next two hours, between 12:00 pm and 2:00 pm, Oracle’s stock oscillated in a range roughly between 233 USD and 234.50 USD. This period can be interpreted as a battleground between bulls trying to regain control and bears seeking to defend the morning’s gains (from their short positions) and push the price lower.
The Afternoon Fade and Closing Consolidation (2:00 pm onwards):
The inability to sustain the midday rally ultimately led to an afternoon fade. Around 2:30 pm, another wave of selling pressure emerged, pushing the stock from its 234 USD perch back down towards the 232 USD mark. Unlike the morning’s sharp cliff-dive, this was a more gradual descent, suggesting seller exhaustion or a new equilibrium being found.
From approximately 4:00 pm, when the main trading session typically closes, until the extended hours depicted, the stock entered a phase of tight consolidation. The line flattens out considerably, hovering just above 232 USD. This indicates that the day’s primary price discovery was over. The final closing price of 232.26 USD reflects this late-day equilibrium.
Section 2: A Forensic Examination of Key Financial Metrics
Beyond the price chart, the screenshot provides a dashboard of fundamental and technical data points. Each of these numbers offers a crucial piece of the puzzle in understanding Oracle’s valuation and market position.
The 52-Week Range: A Story of Tremendous Growth (118.86 – 237.99 USD)
This is perhaps the most dramatic metric provided. Oracle’s stock has traveled from a low of 118.86 USD to a high of 237.99 USD over the past year. This represents more than a 100% gain from its trough. The day’s closing price, while down, is still situated at the extreme upper end of this vast range.
-
Implication 1: Strong Bullish Momentum. This long-term trend is unequivocally bullish. It suggests the company has been executing well, benefiting from positive industry trends (like AI and cloud adoption), and has been rewarded handsomely by investors.
-
Implication 2: Potential for Profit-Taking. Stocks that experience such a rapid and substantial run-up are prime candidates for profit-taking. The day’s 2.13% dip, coming right after the stock touched its 52-week high, is classic behavior. Investors who bought in at lower prices may be cashing out, creating selling pressure that can temporarily overwhelm new buyers. The 237.99 level now acts as a psychological and technical resistance point.
Market Capitalization: 65.24KCr
The market capitalization figure is listed as “65.24KCr”. “KCr” stands for “Thousand Crores,” a unit used in the Indian numbering system (1 Crore = 10 million). Therefore, 65.24KCr equals 65,240 Crore Rupees. To put this in a global context, we would need to convert this to USD. Assuming a Rupee-to-USD exchange rate (e.g., ~83 INR to 1 USD), this translates to approximately $786 billion USD.
-
Significance: This firmly places Oracle in the “mega-cap” category of companies. Its massive size indicates a stable, mature business with a global footprint. This scale provides resilience but also means that large percentage gains are harder to achieve compared to smaller, high-growth companies. It is a cornerstone of many institutional portfolios and index funds.
P/E Ratio: 53.50
The Price-to-Earnings (P/E) ratio of 53.50 is a critical valuation metric. It means that investors are willing to pay $53.50 for every $1 of Oracle’s annual earnings.
-
Interpretation: A P/E of 53.50 is generally considered high for a mature technology company. The average P/E for the S&P 500, for example, is typically in the 20-25 range. This elevated P/E ratio suggests that the market has extremely high expectations for Oracle’s future earnings growth. Investors are likely pricing in significant success from its ventures into cloud infrastructure (OCI) and the integration of AI into its product suite.
-
The Risk: A high P/E ratio also makes a stock vulnerable. If the company fails to deliver on these high growth expectations in future earnings reports, the stock could face a sharp and severe correction as the market reprices its valuation. The day’s sell-off could be partly fueled by concerns that the valuation has become stretched.
Dividend Data: Yield of 0.86% and Quarterly Amount of 0.50 USD
Oracle pays a quarterly dividend of $0.50 per share. Annually, this amounts to
2.00 / 232.26), which equals approximately 0.86%.
-
What it means for investors: A yield of 0.86% is relatively low. This indicates that Oracle is not primarily viewed as an “income stock.” Investors buy Oracle for capital appreciation (stock price growth), not for its dividend payments. Nonetheless, the presence of a consistent dividend is a positive sign. It signals that the company is financially healthy, generates predictable cash flow, and is committed to returning some of its profits to shareholders. It provides a small, but tangible, return even during periods of price stagnation or decline.
Section 3: The Pre-Market Signal – A Bullish Counter-Narrative?
Perhaps the most forward-looking piece of data in the screenshot is the pre-market activity. The data shows the stock trading at 235.71 USD, a gain of +3.45 points (1.49%) from its close.
-
Analysis: This is a powerful signal of positive sentiment emerging after the main session’s close. A 1.49% gain would erase more than two-thirds of the previous day’s 2.13% loss, suggesting an immediate “buy the dip” mentality from some market participants.
-
Potential Causes: This pre-market rally could be driven by several factors that occurred after the market closed:
-
Company-Specific News: A positive press release, a new major client announcement, or an analyst upgrade.
-
Broader Market Optimism: Positive economic data or a rally in the futures market could be lifting all stocks.
-
A Technical Rebound: The stock may have simply been seen as “oversold” after the day’s dip, prompting a technical bounce from a support level.
-
Investors will be watching intently to see if these pre-market gains hold into the next day’s official open. A strong open would confirm the rebound, while a failure to hold these gains could suggest a “bull trap” and further weakness ahead.
A Stock at an Inflection Point
The snapshot of Oracle Corp.’s trading day is more than just a collection of numbers; it’s a microcosm of the forces shaping a mega-cap tech stock in today’s market. We see a company whose long-term performance has been stellar, pushing its valuation to optimistic, if not expensive, levels. This success has brought it to a critical juncture near its all-time high, where the bullish momentum of the past year collided with the bearish pressure of profit-taking.
The 2.13% loss, while significant for a single day, must be seen in the context of a stock that has doubled in value. The key takeaway is the tension between a high P/E valuation that demands perfection and the fundamental strength that has driven its ascent. The pre-market rally adds a final, tantalizing twist, suggesting the bulls have not yet ceded the field. The next few trading sessions will be crucial in determining whether this was a healthy consolidation before the next leg up, or the first sign of a peak for Oracle’s impressive run.


