Johnson & Johnson Stock Analysis: Key Levels to Watch After Yesterday’s Downtrend

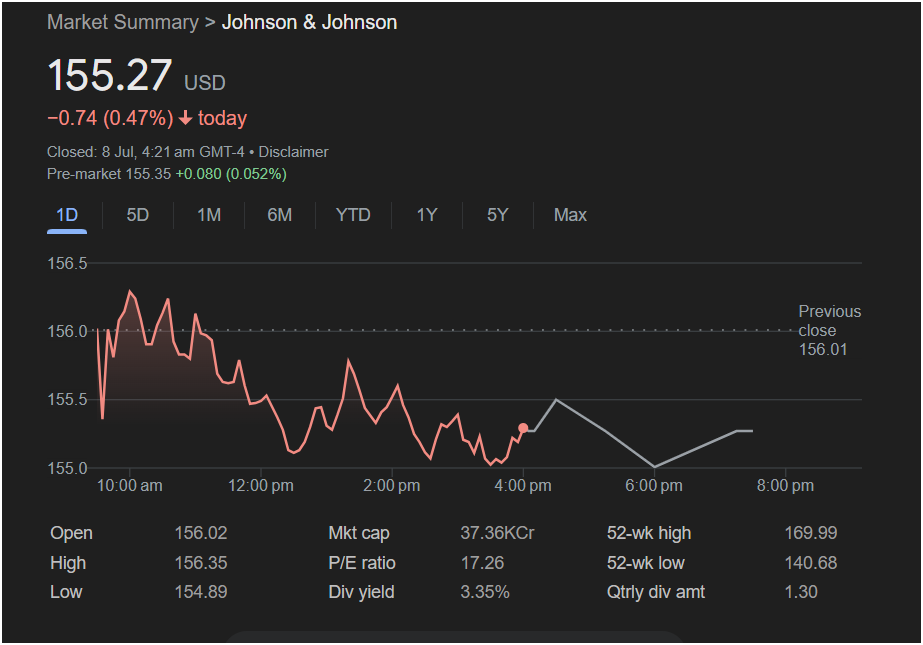
Johnson & Johnson stock (JNJ) experienced a notable bearish session, closing down significantly and establishing a clear downward trend for the day. However, a slight uptick in pre-market trading suggests a potential battle between buyers and sellers at the opening bell. For traders, understanding the key price levels from the previous session is paramount to navigating today’s market. This article will break down all the critical data from the chart.
 Current Market Snapshot
Let’s begin with the essential numbers that set the stage for today’s trading.
-
Last Closing Price: 155.27 USD
-
Yesterday’s Change: -0.74 (0.47%)
-
Previous Day’s Close: 156.01 USD
-
Pre-Market Price: 155.35 USD (+0.080 / +0.052%)
The stock closed nearly half a percent lower, well below its previous closing price. The pre-market gain is minimal, indicating some stabilization but not yet a strong reversal signal.
Technical Analysis of the 1-Day Chart
The 1-day chart paints a clear picture of selling pressure throughout the session.
-
Intraday Support: The critical support level was established at the day’s low of $154.89. This is the price floor that sellers were unable to break. A move below this level today would be a significant bearish signal.
-
Intraday Resistance: The high for the day was $156.35. This level was set early in the session before the downtrend took hold. This price now acts as the primary resistance level to overcome for any bullish reversal.
-
Price Action: The stock opened near its high and sold off consistently, creating a series of lower highs and lower lows. This is a classic intraday downtrend. The price remained well below the previous close line ($156.01) for most of the day, confirming bearish control.
Key Financial Metrics for Traders
These fundamental metrics provide a broader context for the stock’s behavior and appeal.
| Metric | Value | Insight for Traders |
| Open | 156.02 | Opened just above the previous close but was immediately met with selling. |
| High | 156.35 | The key resistance level to watch. |
| Low | 154.89 | The key support level to watch. |
| P/E Ratio | 17.26 | A relatively low P/E ratio, suggesting the stock is viewed as a value play rather than a high-growth stock. |
| Div Yield | 3.35% | A very strong dividend yield. This is a key feature that attracts income-focused investors and can provide a “soft floor” for the price. |
| 52-wk High | 169.99 | The stock is trading well off its yearly highs. |
| 52-wk Low | 140.68 | The stock is still comfortably above its yearly lows. |
| Qtrly div amt | 1.30 | Confirms a consistent dividend payment. |
Is it Right to Invest in Johnson & Johnson Stock Today?
Disclaimer: This analysis is based on the provided data and is for informational purposes only. It is not financial advice. All trading involves risk, and you should conduct your own research and consult with a financial professional before making any investment decisions.
Based on the available information, here are the potential scenarios for today’s trading session.
The Bearish Case (Reasons for Caution):
-
Dominant Downtrend: The chart shows a clear, established downtrend from the previous session. The path of least resistance could be to the downside.
-
Weak Pre-Market Bounce: A gain of only +0.052% is not a convincing sign of a reversal. It could simply be minor profit-taking from short-sellers or a small “dead cat bounce.”
-
Overhead Resistance: The stock has to fight through the price levels of the previous day, including the key resistance at $156.35, to establish any bullish momentum.
The Bullish Case (Reasons for Optimism):
-
Support Held: The stock did not close at its absolute low, and the $154.89 support level held. If buyers step in at this level again, it could form a base for a recovery.
-
Value and Dividend Appeal: For long-term investors, a dip in a blue-chip dividend stock like J&J can be seen as a buying opportunity. The attractive 3.35% dividend yield might entice buyers at these lower prices, providing support.
for a Trader:
Caution should be the primary approach for Johnson & Johnson stock today. The prevailing trend is bearish.
-
A trader might look for a re-test of the $154.89 support level. If it holds firmly, it could offer a low-risk entry point for a potential bounce.
-
A break below $154.89 would confirm the downtrend is continuing and could present a shorting opportunity.
-
For a bullish position, it would be more prudent to wait for a decisive move and close above the resistance area around $156.01 – $156.35.
Given the strong selling pressure from yesterday, jumping in early is risky. Watching how the price reacts to the key support and resistance levels will be the most effective strategy for today.


