Apple Inc. stock experienced a notable downturn in its last trading session, and traders are now closely watching for signs of its next move. Analyzing the latest data is key to navigating the potential opportunities and risks in the upcoming session.
Disclaimer: This article is an analysis of historical data and is for informational purposes only. It does not constitute financial or investment advice.
Today’s Market Performance Summary
The provided market summary for Apple Inc. shows a closing price of
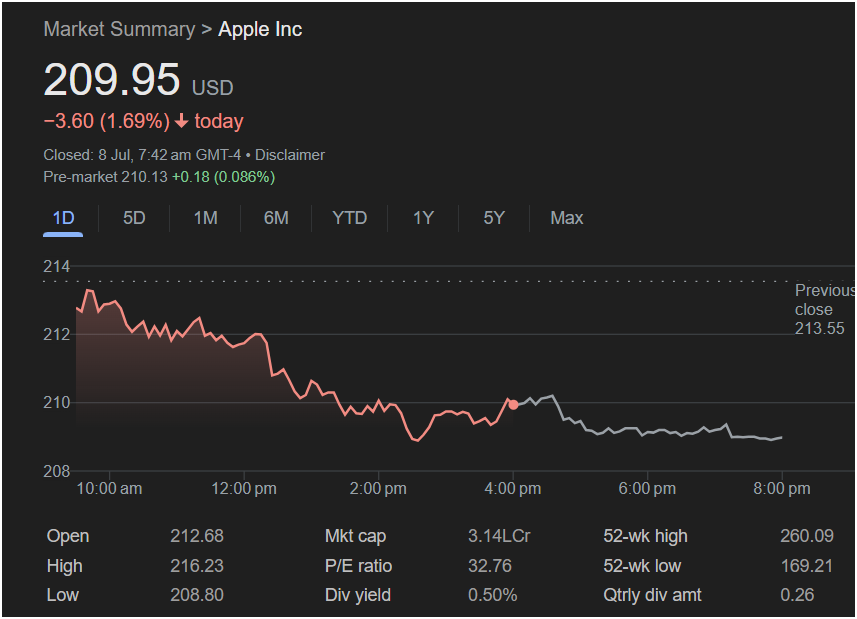
3.60, or 1.69%, for the day, indicating strong selling pressure.
Looking ahead, the pre-market data offers a sliver of hope for bulls. The stock is quoted at
0.18 (0.086%) from the close. While positive, this slight uptick does little to offset the previous day’s substantial loss and suggests a cautious open may be ahead.
A Trader’s Look at the 1-Day Chart
The intraday chart reveals a classic bearish trend for the session:
-
The Open: Apple stock opened the day at $212.68, below the previous close of $213.55.
-
Early High: It briefly rallied to a session high of $216.23 in the morning.
-
Sustained Sell-off: Following this peak, sellers took firm control, pushing the stock price consistently lower throughout the afternoon.
-
The Close: The stock hit a low of $208.80 and closed near this level. Closing near the day’s low is often considered a bearish signal, as it indicates that sellers were dominant right into the market’s close.
Key Financial Metrics a Trader Needs
The image provides several crucial data points for a comprehensive analysis:
-
Daily Price Range:
-
High: $216.23
-
Low: $208.80
-
This wide range of over $7 highlights the day’s volatility and the strength of the downtrend.
-
-
Valuation and Context:
-
Market Cap: 3.14L Cr (likely representing 3.14 Trillion USD), underscoring its status as one of the world’s largest companies.
-
P/E Ratio: 32.76, a key metric for assessing valuation.
-
52-Week Range: The stock has traded between
260.09. The current price, while down for the day, is still comfortably in the upper half of its yearly range.
-
-
Dividend Information:
-
Div Yield: 0.50%
-
Qtrly Div Amt: $0.26
-
This provides a small but steady income stream for long-term investors.
-
Is It Right to Invest in Apple Stock Today?
Synthesizing the data provides a clearer picture for traders considering a position.
Potential Bearish Signals (Reasons for Caution):
-
Strong Negative Close: A 1.69% drop is a significant move that shows conviction from sellers.
-
Bearish Intraday Pattern: The failure to hold early gains and the consistent sell-off throughout the day point to negative sentiment.
-
Closing Near the Low: This suggests momentum was still to the downside at the end of the session.
Potential Bullish Signals (Reasons for Optimism):
-
Minor Pre-Market Rebound: The slight pre-market gain indicates some buyers may be viewing the lower price as an entry point.
-
Long-Term Strength: The stock remains well above its 52-week low, suggesting the broader trend is still intact.
for the Trader:
The evidence from the last trading session leans bearish. The strong sell-off and close near the low suggest that caution is warranted. The minor pre-market gain is not yet enough to signal a reversal.
Traders should watch the previous day’s low of
212-$213 area (the open and previous close), it might indicate that the sell-off was a one-day event. Given the strong bearish momentum, a “wait-and-see” approach at the market open may be the most prudent strategy.