
Costco Wholesale Corp. (COST) stock ended the last trading session with a flat 0.00% change, but the static closing price of $982.36 masks a turbulent day of trading that saw a sharp sell-off and a powerful recovery. This battle between buyers and sellers has created key technical levels for investors to watch as the market heads into the next session.
Here’s a breakdown of the critical information every trader needs to know about Costco’s recent stock performance.
The Story of the Trading Day
While Costco closed exactly where it started, the day was anything but quiet.
-
Chart Pattern: The 1-day chart reveals a classic “V-shaped” pattern. The stock peaked early in the session near the $985 mark before facing significant selling pressure that pushed it to an intraday low of approximately $976 around midday.
-
A Bullish Reversal: From that low point, buyers stepped in with force, driving the stock all the way back up to its opening price by the end of the day. This strong recovery indicates powerful underlying support and buyer interest at the lower levels.
-
Pre-Market Signal: Pre-market data shows the stock trading slightly down at $981.80, a minor dip of -0.56 (0.057%). This could signal some minor profit-taking or a cautious start to the next trading day.
Key Financial Metrics to Consider
A look at Costco’s fundamentals provides crucial context to its current stock price:
-
Market Cap: Costco boasts a formidable market capitalization of approximately $435.7 Billion (43.57KCr), highlighting its position as a retail industry leader.
-
P/E Ratio: The stock’s Price-to-Earnings ratio is high at 55.73. This premium valuation suggests that investors have very high expectations for the company’s future growth and are willing to pay a premium for its shares.
-
52-Week Range: The current price of
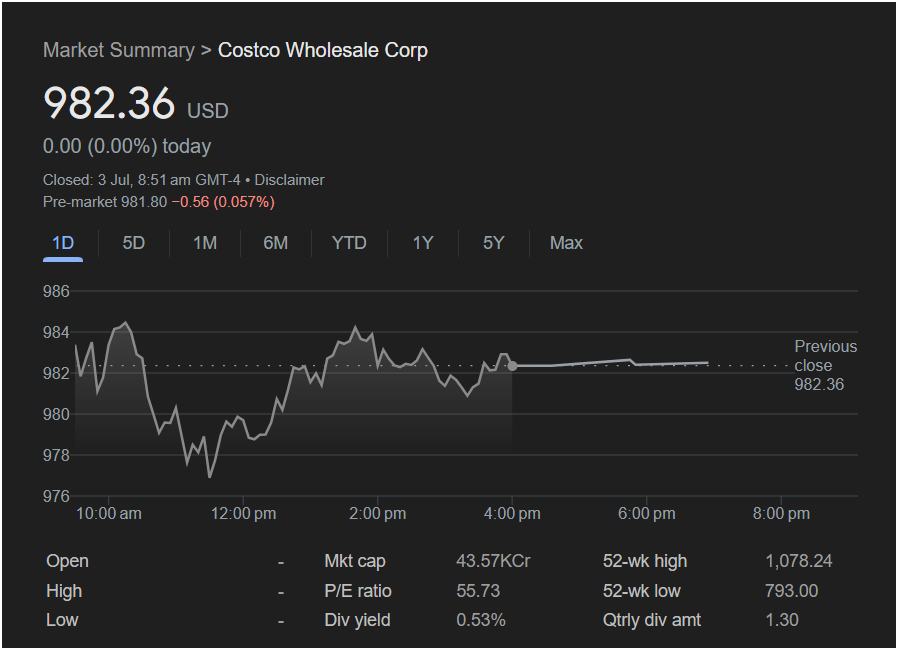
793.00** to a high of $1,078.24.
-
Dividend: The company offers a dividend yield of 0.53%, with a quarterly payout of $1.30 per share.
Outlook for Monday: Will the Stock Go Up or Down?
The intraday volatility provides clues for both bullish and bearish scenarios.
The Bullish Case: The strong rebound from the intraday low of ~$976 is the most significant bullish signal. It demonstrates that buyers see value at that price and are willing to defend it aggressively. If this positive sentiment carries over, the stock could re-test and break through the intraday high near $985, potentially signaling a move back towards its 52-week high.
The Bearish Case: The initial sell-off confirms that there is resistance and selling pressure at these elevated levels. The high P/E ratio makes the stock vulnerable to any negative market news or a shift in sentiment away from growth stocks. A break below the critical support level of ~$976 would be a significant bearish signal, indicating that sellers have regained control.
Conclusion: Is It a Good Day to Invest?
The decision to invest in Costco today hinges on your trading strategy and risk tolerance.
-
Short-term traders should watch the key levels established in the last session. The battle is between the support at ~
985. The price action around these two points on Monday will likely determine the stock’s short-term direction.
-
Long-term investors might be less concerned with the daily swings and more focused on the company’s strong business model. However, the high P/E ratio is a crucial factor to consider, as it implies that much of the future growth is already priced into the stock.
Given the conflicting signals, a cautious approach is warranted. The market’s opening direction on Monday will be critical in determining whether the bulls or the bears will win the next round.
Disclaimer: This article is for informational purposes only and is based on the data provided in the screenshot. It does not constitute financial advice. All investment decisions should be made with the help of a qualified financial professional.


