Procter & Gamble Stock Analysis: Flat Close Signals Stability and a Key Decision Point for Monday

Procter & Gamble Co (PG) stock ended the recent trading session in a rare state of perfect equilibrium, signaling a moment of indecision in the market that traders will be watching closely on Monday. For a blue-chip staple like P&G, this pause, combined with its strong fundamental metrics, offers critical clues about its next potential move.
This analysis will break down the latest market summary to help traders and investors understand the forces at play and determine if now is the right time to invest.
Friday’s Market Recap: A Battle to a Standstill
Procter & Gamble stock closed the day at
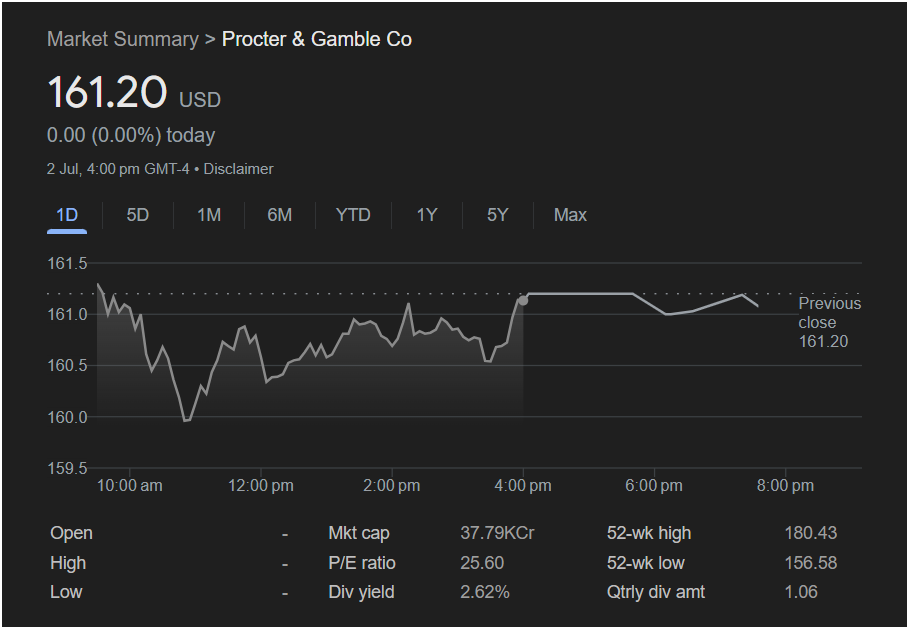
0.00 (0.00%). This flat close means the stock ended the session at the exact same price as its previous close, a clear sign of a tug-of-war between buyers and sellers where neither side could claim victory.
The intraday chart tells a more dynamic story:
-
The stock experienced selling pressure early in the session, dropping to a daily low near the $160.00 mark.
-
Buyers stepped in decisively at this level, driving a steady recovery throughout the afternoon.
-
The stock rallied into the close, managing to erase all its losses and finish precisely where it started. This V-shaped recovery off the day’s low is a bullish sign, indicating strong underlying support.
The Outlook for Monday: Stability is the Story
Unlike more volatile tech stocks, the key indicator for P&G going into Monday isn’t dramatic pre-market action, but its fundamental stability. With no pre-market data shown, the analysis must focus on the session’s trading and the stock’s core characteristics.
The most important factors for Monday are:
-
Strong Support at $160: The chart clearly shows that investors were eager to buy the stock as it approached the $160 level. This price is now established as a key short-term support level.
-
The Dividend Yield: P&G offers a substantial dividend yield of 2.62%. For income-seeking investors, a lower stock price makes this yield even more attractive. This acts as a natural cushion, providing a reason for investors to buy on dips and limiting downside potential.
-
Proximity to 52-Week Low: The stock’s current price of $161.20 is much closer to its 52-week low of $156.58 than its high of $180.43. This could attract value investors who see the current level as a discounted entry point for a high-quality company.
Key Metrics Every Trader Should Know
-
Closing Price: $161.20
-
Key Support Level: ~$160.00
-
Key Resistance Level: ~$161.20 (the closing price and previous high)
-
52-Week Range: $156.58 – $180.43
-
P/E Ratio: 25.60
-
Dividend Yield: 2.62%
Is It the Right Time to Invest?
The answer depends on your investment style.
-
For the Short-Term Trader: The flat close signals indecision. A trader might wait for a confirmed move. A break above $161.20 on strong volume could signal a new leg up, while a drop below the $160 support level could indicate further weakness.
-
For the Long-Term Investor: The picture is more compelling. Buying a world-class consumer staples company near its 52-week low while collecting a 2.62% dividend is a classic long-term investment strategy. The stock’s stability and income potential are its primary attractions.
In conclusion, Procter & Gamble stock is at a crossroads. While immediate momentum is neutral, its strong support and attractive dividend suggest a stable foundation. Investors on Monday should watch the $160 level closely as it will likely dictate the stock’s direction for the week.
Disclaimer: This article is for informational purposes only and is based on the analysis of the provided image. It should not be considered financial advice. All investors should conduct their own research and consult with a financial professional before making any investment decisions.


