
Visa Inc. (V) stock ended its last trading session completely unchanged, closing at $354.22 with a 0.00% move. However, this flat-line finish conceals a day of significant volatility and a clear battle between buyers and sellers, establishing critical price levels that traders must watch heading into Monday’s market.
Here is a comprehensive breakdown of Visa’s recent performance and the key takeaways for your trading strategy.
A Volatile Day in Review
Despite the neutral close, the journey to get there was anything but calm.
-
Chart Pattern: The 1-day chart for Visa stock shows a dramatic W-shaped pattern. The stock gapped up at the open to an intraday high near
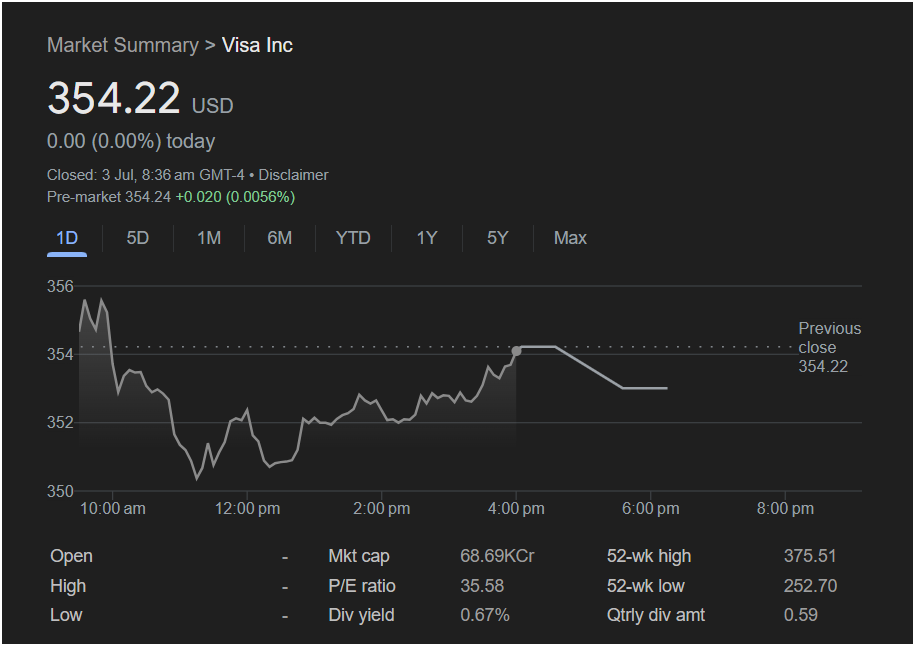
350.
-
The Rebound: From the midday low, buyers showed their strength, staging a steady recovery throughout the afternoon. This rebound erased all the day’s losses, bringing the stock back to its exact previous closing price. This strong recovery from the lows is a significant bullish signal.
-
Pre-Market Signal: Pre-market activity is nearly flat, showing the stock up a negligible
354.24. This suggests a quiet start to the next session, leaving it up to the opening bell to set the tone.
Vital Financial Metrics for Traders
Understanding Visa’s fundamental picture is crucial for context:
-
Market Cap: As a financial services giant, Visa commands a massive market capitalization of approximately $686.9 Billion (68.69KCr).
-
P/E Ratio: The stock’s price-to-earnings ratio is 35.58. This is a premium valuation, indicating that investors have high expectations for Visa’s future earnings growth.
-
52-Week Range: The current price sits in the upper portion of its 52-week range, which goes from a low of
375.51.
-
Dividend: Visa provides a dividend yield of 0.67%, paying a quarterly dividend of $0.59 per share.
Outlook for Monday: Will the Stock Go Up or Down?
The intraday price action has carved out a clear trading range that will be pivotal on Monday.
The Bullish Case: The powerful recovery from the
356, it could trigger a new wave of buying and a potential run towards the 52-week high.
The Bearish Case: The initial sharp rejection from the
350 support level on a subsequent test would be a significant bearish development.
: Is Today the Right Day to Invest?
Your investment decision should be guided by the clear technical levels and your personal trading style.
-
For short-term traders: The key is to watch the battle between the support at
356. A decisive break in either direction will likely dictate the stock’s next move. The flat pre-market suggests traders are waiting for a catalyst.
-
For long-term investors: The daily volatility is less of a concern. The focus remains on Visa’s dominant position in global payments and its long-term growth story. However, the premium valuation (high P/E) is a factor to weigh against the company’s strong fundamentals.
Monday’s opening price action will be crucial. Observers will be watching to see whether the bullish recovery has the momentum to continue or if sellers will take advantage of the price returning to its previous levels.
Disclaimer: This article is for informational purposes only and is based on the data provided in the screenshot. It does not constitute financial advice. All investment decisions should be made with the help of a qualified financial professional.


