
Berkshire Hathaway Inc. Class A (BRK.A) stock finished the recent trading day on a downward trajectory, leaving investors and traders to closely watch Monday’s market open for signs of a continued slide or a potential rebound. The high-priced stock saw significant selling pressure, closing down 1.73% for the day.
Here is a comprehensive breakdown of the key data from the last trading session to help you prepare for the week ahead.
The Day’s Trading Action
Berkshire Hathaway’s Class A stock closed at
12,650.00. The trading day was characterized by immediate bearish sentiment.
-
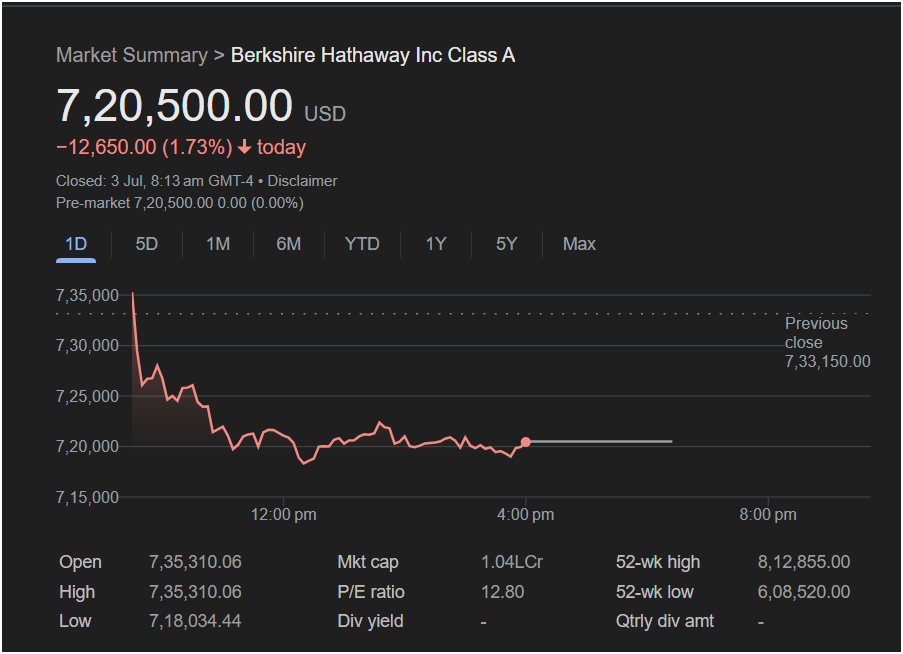
Open / High: The stock opened at its highest point of the day, $735,310.06, indicating that sellers took control right from the opening bell and pushed the price down throughout the session.
-
Low: The stock hit an intraday low of $718,034.44 before finding some support.
-
Chart Pattern: The 1-day chart shows a sharp drop early in the trading session, followed by a period of consolidation at a lower range. The stock was unable to reclaim its opening price, closing significantly below the previous day’s close of $733,150.00.
Pre-market data showed the stock as flat at $720,500.00 (0.00%), suggesting no major news had influenced the price in after-hours trading.
Key Financial Metrics for Traders
Beyond the daily price movement, several key metrics provide a broader context for Berkshire Hathaway’s current market position:
-
Market Cap: The company maintains a massive market capitalization of approximately $1.04 Trillion (1.04LCr), cementing its status as one of the largest and most stable companies in the world.
-
P/E Ratio: At 12.80, the Price-to-Earnings ratio is relatively modest, a characteristic that often attracts value investors who see the stock as reasonably priced compared to its earnings.
-
52-Week Range: The current price sits comfortably between its 52-week low of
812,855.00. While it’s well off its peak, it remains significantly above its yearly low.
-
Dividends: As is its long-standing policy, Berkshire Hathaway does not pay a dividend, reinvesting all profits back into the company.
Outlook for Monday: Will the Stock Go Up or Down?
Based on the available data, traders will be weighing conflicting signals heading into Monday’s session.
The Bearish Case: The strong downward momentum and the fact that the stock opened at its daily high are bearish indicators. It suggests that sellers dominated the session, and without a positive catalyst, that sentiment could carry over. Traders will be watching to see if the stock breaks below the recent low of $718,034.44, which could signal further downside.
The Bullish Case: Value investors might view this 1.73% dip as a buying opportunity. The stock’s relatively low P/E ratio and its position as a market behemoth suggest long-term stability. A trader looking for a rebound might see the consolidation in the latter half of the day as a sign that the worst of the selling is over.
for Investors:
The decision to invest today depends heavily on your strategy. Short-term traders should be cautious of the negative momentum from the previous session. Long-term investors, however, are less likely to be swayed by a single day’s performance and may focus more on the fundamental value indicated by the P/E ratio and the company’s formidable market cap.
Ultimately, the direction of Berkshire Hathaway’s stock on Monday will be influenced by broader market sentiment and any emerging news. Traders should watch the opening price action closely for clues to the day’s trend.
Disclaimer: This article is for informational purposes only and is based on the data provided in the screenshot. It does not constitute financial advice. All investment decisions should be made with the help of a qualified financial professional.


