
SEATTLE – Microsoft Corp. (NASDAQ: MSFT) stock is facing a potentially bearish start to the week, as significant pre-market selling pressure casts a shadow over a stock trading just shy of its all-time high. After closing the previous session completely flat, traders are now on high alert for a crucial test of support when the market opens on Monday.
This analysis breaks down all the vital information from the latest market data to prepare you for the upcoming trading day.
A Session of Selling and Stabilization
The one-day chart for Microsoft stock tells a story of initial weakness followed by a tense standoff. The session began with the stock trading near $498 before a sharp decline took hold, pushing the price down to a low near the
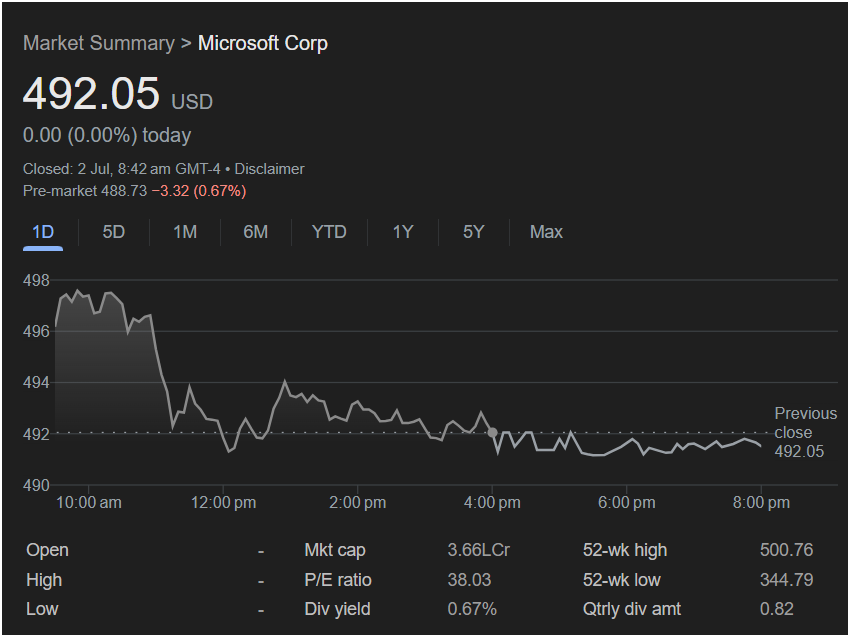
492 level by midday.
From that point on, the stock entered a consolidation phase, trading in a narrow range for the rest of the day. Despite the recovery from the lows, it was unable to reclaim its earlier strength, ultimately finishing the day exactly where it started at a previous close of $492.05. This flat close after a significant intraday drop suggests a market in equilibrium, but the pre-market activity indicates that equilibrium may be about to break.
The Pre-Market Warning Sign
The most critical indicator for Monday’s open is the pre-market trading data. As of the last update (8:42 am GMT-4), Microsoft stock was trading at $488.73.
-
Change: Down $3.32
-
Percentage: Down 0.67%
This is a notable pre-market decline, suggesting that negative sentiment has built up. This could lead to a “gap down” open, where the stock begins trading on Monday at a price significantly lower than its previous close.
Key Financial Metrics for Context
Understanding the bigger picture is essential for any trade, and Microsoft’s key metrics provide valuable context:
-
Market Cap: 3.66LCr: This confirms Microsoft’s status as one of the largest and most influential companies in the world, with a multi-trillion dollar valuation. Its performance can often influence the broader market.
-
P/E Ratio: 38.03: A Price-to-Earnings ratio of 38 is healthy for a high-growth tech giant like Microsoft. It indicates investor confidence in future earnings without being in extreme bubble territory.
-
52-Week High/Low: $500.76 / $344.79: This is the most important context. The stock’s closing price of $492.05 is just a stone’s throw away from its 52-week (and all-time) high of $500.76. This $500 level is a major psychological barrier where traders are often tempted to sell and take profits.
-
Dividend Yield: 0.67% (Qtrly Div Amt: 0.82): Microsoft provides a modest dividend, which adds a small incentive for long-term holders.
Will the Market Go Up or Down on Monday?
The data presents a compelling case for a potential downward move, but the bulls should not be counted out.
The Bearish Case:
The primary evidence is the pre-market drop of 0.67%. This, combined with the stock’s proximity to the psychologically significant $500 resistance level, creates a strong setup for profit-taking. The intraday sell-off from $498 in the last session shows that sellers are already active at these levels. A failure to hold the support around
492 could see the stock fall further.
The Bullish Case:
Despite the morning sell-off, the stock found solid support and refused to break down further for the entire afternoon. This indicates that buyers see value at the $492 level. Mega-cap stocks like Microsoft are often seen as “buy the dip” opportunities by large institutions. If the market can absorb the pre-market selling and push back above $492.05, it could trap the bears and fuel a rally to test the $500 high once more.
Verdict for Monday:
Given the significant pre-market weakness, it is not right to make an impulsive investment at the open. The immediate outlook leans bearish. A cautious approach is critical.
Traders should watch the
492 support zone with extreme prejudice. A clean break below this area on high volume would confirm that sellers are in control. Conversely, if the stock opens lower but quickly reclaims the $492 level, it could signal a false breakdown and a potential buying opportunity for aggressive traders. Monday’s session will be a battle over this key support level.
Disclaimer: This article is for informational purposes only and is based on an analysis of the provided image. It does not constitute financial advice. All investment decisions should be made based on your own research and consultation with a qualified financial advisor. Stock markets are volatile, and past performance is not indicative of future results.

