Eli Lilly And Co (LLY) stock is firmly on the radar of traders this morning, with pre-market indicators pointing to continued positive sentiment after a strong previous session. The pharmaceutical giant showed significant resilience, and investors are now watching to see if the stock has enough momentum to challenge its recent highs. This detailed analysis breaks down the essential data for anyone considering a trade in Eli Lilly stock today.
Key Performance Metrics at a Glance
Before the opening bell, it’s crucial to understand where the stock stands. Here is a snapshot of Eli Lilly’s latest financial data:
-
Last Closing Price: $778.08 USD
-
Day’s Gain: +$7.44 (+0.97%)
-
Pre-Market Price: **
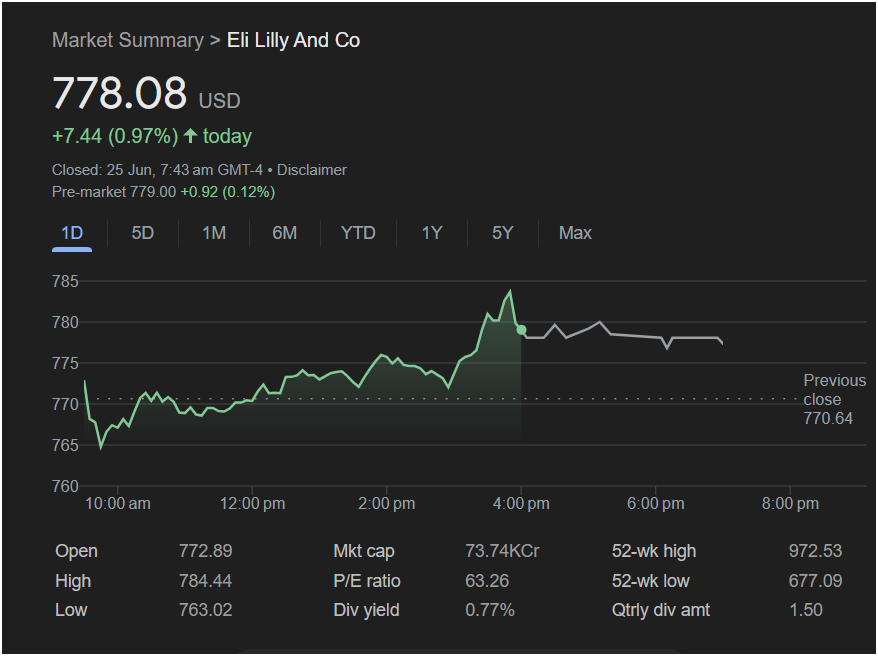
0.92 or 0.12%)
-
Previous Day’s Close: $770.64
-
Day’s Trading Range: $763.02 (Low) to $784.44 (High)
-
52-Week Range: $677.09 (Low) to $972.53 (High)
-
Market Cap: Approximately $737.4 Billion
-
P/E Ratio: 63.26
Technical Analysis: The Story on the Chart
The one-day (1D) chart for Eli Lilly stock tells a compelling story of a battle between buyers and sellers. After opening at
763.02**. However, buyers quickly stepped in, initiating a steady upward trend for the remainder of the day.
The bullish momentum peaked in the afternoon, pushing the stock to its daily high of $784.44. This level proved to be a point of resistance, as the stock pulled back slightly to close at $778.08. The positive pre-market activity suggests buyers are re-emerging, setting the stage for a critical test of this resistance level in today’s session.
Key price levels to watch today are:
-
Immediate Resistance: The day’s high of $784.44 is the most critical level. A sustained break above this point could signal that the bulls are in control and may trigger a new upward move.
-
Support Levels: If the stock fails to break resistance, the first area of support is its recent closing price around
772.89 and the previous close of 763.02 serves as a major support level.
Should You Invest in Eli Lilly Stock Today?
The Bullish Argument:
The stock’s ability to recover from a significant morning dip and close with a nearly 1% gain is a strong bullish signal. Combined with the positive pre-market trend, the momentum appears to be on the side of the buyers. A successful breach of the $784.44 resistance could open the door for further gains.
The Argument for Caution:
The failure to hold the daily high of $784.44 into the close indicates that some selling pressure or profit-taking exists at that level. Furthermore, the stock’s P/E ratio of 63.26 is relatively high, suggesting that investors have already priced in significant future growth. This can make the stock vulnerable to pullbacks on any market-wide weakness or negative news.
For traders, today’s session for Eli Lilly stock will likely be defined by the battle at the $784.44 resistance level.
-
A confident strategy would be to watch for a clean break and hold above this price on good trading volume as a potential entry signal for a long position.
-
A more conservative trader might wait for a pullback toward the support level around $778 to see if buyers defend that price before entering.
The overall sentiment appears positive, but confirmation of bullish strength at the key resistance point will be the deciding factor for the stock’s direction today.
Disclaimer: This article is for informational and analytical purposes only, based on the data provided in a single screenshot. It is not financial advice. All investment decisions should be made after conducting your own thorough research and consulting with a qualified financial advisor. Stock markets are volatile, and past performance is not indicative of future results.