Key Information from the Chart (as of the last data point shown, likely June 13, 2025, or very close to it):
- Ticker Symbol: KKR (NYSE)
- Timeframe: 1-Day (Each candlestick represents one day’s trading)
- Last Closing Price (C): $153.81
- Change Today (from previous close): +4.51 (+3.02%)
- Open (O): $146.92
- High (H): $154.40
- Low (L): $146.92
- Volume (Vol): 6.67 M (Million)
- Current Bid/Ask (from top left): SELL: $122.50, BUY: $123.66 (Note: These might be real-time quotes if the screenshot was live, but given the chart, they serve as a general reference of liquidity and appear to be significantly lower than the last closing price, indicating a potential data discrepancy or out-of-sync quote.)
- Previous Close (from the orange horizontal line marking a specific point): $125.24 (This appears to be a historical data point, likely from a previous day’s close for which the pre-market is shown as $123.50).
- Pre (Pre-market/After-hours price, indicated on the right): $123.50
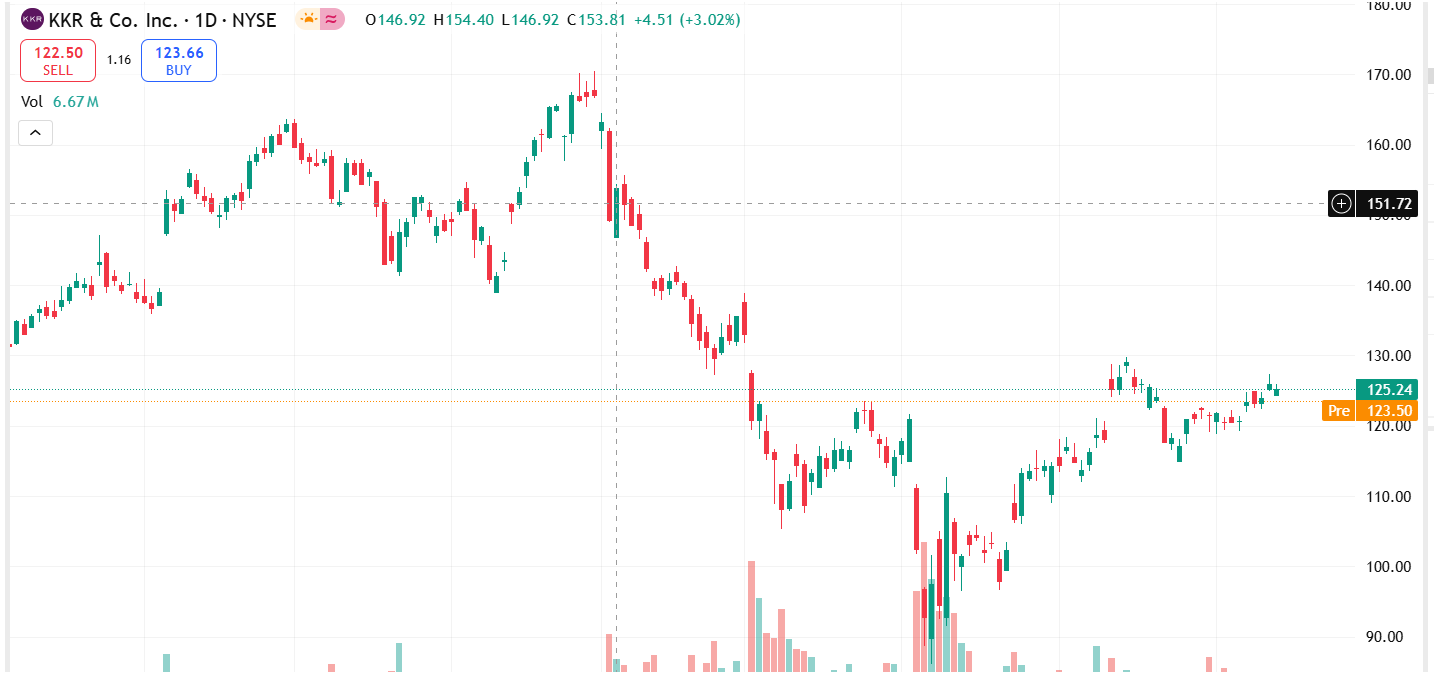 Chart Interpretation for Traders:
-
Long-Term Trend:
- The chart shows that KKR stock had a significant rally earlier in the year, reaching highs near $170.
- This was followed by a sharp and prolonged downtrend, bringing the price down to the low $100s or high $90s.
- More recently (from late May/early June onwards), the stock appears to be in a recovery phase, forming an uptrend with higher lows and higher highs.
-
Recent Price Action:
- The last few candlesticks show strong bullish momentum, with green (up) candles dominating. The most recent candlestick is a large green candle, closing near its daily high at $153.81 with a significant daily gain of +3.02%. This suggests strong buying interest on that particular day.
- However, there’s a discrepancy: the price information at the top right ($153.81 C) conflicts with the SELL/BUY quotes ($122.50/$123.66) and the Pre-market price ($123.50) on the bottom right. This implies that the chart’s last closing price is likely for a date prior to the date when the pre-market quote of $123.50 was taken, or the top-right information is from a different session/date than the pre-market/bid-ask. A trader would need to clarify the current real-time price immediately. Assuming the chart’s closing price of $153.81 is the most recent market close for the candlestick data presented, then the pre-market quote of $123.50 suggests a significant gap down for the next trading session shown in the pre-market. This is a critical observation.
-
Support and Resistance Levels:
- The previous high around $170 acts as a significant resistance level.
- The price range around $125 (where the orange line is and the pre-market price is shown) appears to be a significant support/resistance flip zone. The stock previously bounced from there and recently broke above it, but if the pre-market price is accurate ($123.50), then it’s trading below this level again.
- The lows around $90-$100 acted as strong support during the recent bottoming process.
-
Volume Analysis:
- During the recent uptrend, especially on strong up days, there has been an increase in volume, which supports the validity of the upward movement.
- The last bar shows 6.67M volume, indicating significant trading activity on that specific day.
What a Trader Needs to Consider for Today (General Principles, NOT Specific Advice for KKR):
- Clarify the Real-time Price: The most crucial step is to get accurate, real-time pricing for KKR (MDT) including current bid/ask, last trade, and any pre-market or after-hours movement. The conflicting information in the screenshot is a red flag that needs immediate resolution. If the stock is indeed trading around $123.50 in pre-market after closing at $153.81, that indicates a massive negative development or a significant data error.
- News and Catalysts: Search for any recent news specifically related to KKR. This could include earnings reports, analyst ratings, new investments, divestitures, or broader news affecting the private equity sector. A large price discrepancy (if confirmed) would almost certainly be tied to significant news.
- Fundamental Analysis: While the chart shows technicals, understanding KKR’s business model (private equity, alternative asset management), recent financial performance, and future outlook is crucial. How are their funds performing? What’s the interest rate environment like?
- Risk Management:
- Volatility: KKR can be quite volatile, as evidenced by the large swings on the chart. Traders must be prepared for this.
- Stop-Loss Orders: Essential for limiting potential losses, especially given the potential for sharp moves.
- Position Sizing: Allocate capital wisely, considering the stock’s volatility.
- Profit Targets: Identify realistic price targets for potential gains.
- Market Sentiment: How is the overall market performing today? Is there a risk-on or risk-off sentiment?
Is it Right to Invest Today?
Based solely on this screenshot, and especially given the conflicting price information, it is absolutely not possible to advise whether to invest today. The discrepancy in prices ($153.81 vs. $123.50 pre-market) is a critical issue that must be resolved with real-time data before any consideration of investment.
Any investment decision must be based on comprehensive, up-to-the-minute research, understanding the company’s fundamentals, analyzing current market conditions, and aligning with your personal investment goals and risk tolerance. It is always recommended to consult a qualified financial advisor for personalized advice.