
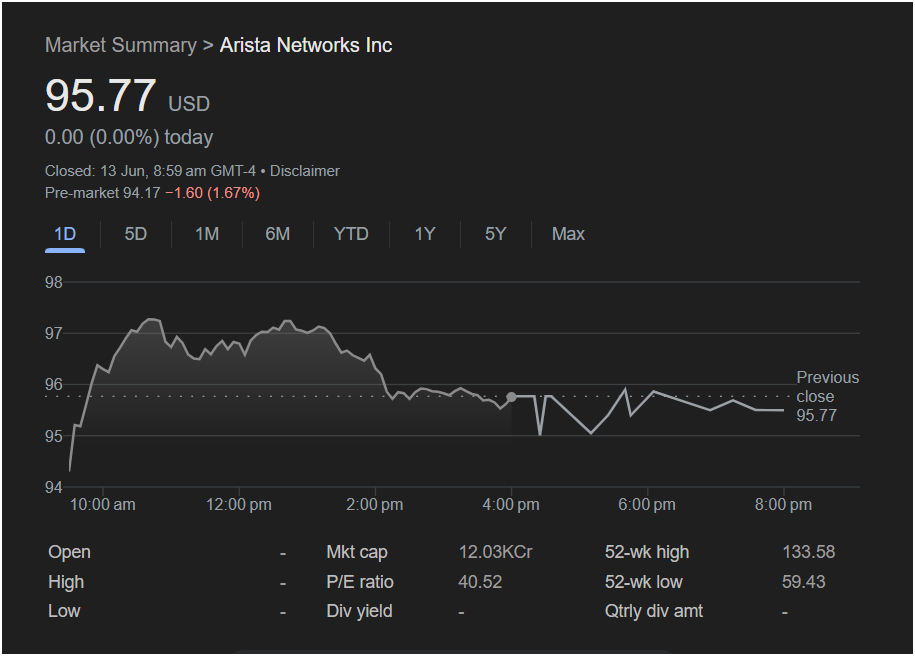
Key Information from the Snapshot (as of June 13th, 8:59 AM GMT-4):
- Current Price (Last Close): $95.77 USD
- Today’s Change: 0.00 (0.00%) today (This refers to the closing price, not pre-market activity)
- Pre-market Price: $94.17 (down $1.60 or 1.67%) – This indicates a potential opening lower than the previous close.
- Market Cap: 12.03 KCr (This is a significant market capitalization, indicating a large, established company)
- P/E Ratio: 40.52 (This is a relatively high P/E ratio, suggesting the stock is priced for growth)
- Dividend Yield: Not available in the screenshot.
- Quarterly Dividend Amount: Not available in the screenshot.
- 52-week High: $133.58
- 52-week Low: $59.43
- Open, High, Low for the day: Not available in the screenshot, as the market was closed.
 What a Trader Might Consider (General Points, NOT Specific Advice for Arista Networks):
-
Current Price vs. 52-Week Range: The stock closed at $95.77, which is considerably below its 52-week high of $133.58 but well above its 52-week low of $59.43. This suggests it’s in the mid-range of its annual performance, potentially indicating either a recovery opportunity from its highs or continued consolidation.
-
Pre-market Movement: The pre-market decline of 1.67% is a notable dip. This suggests negative sentiment before the market opens for the trading day following June 13th. Traders would need to investigate the reason for this decline (e.g., company-specific news, broader market weakness, analyst actions).
-
P/E Ratio: A P/E ratio of 40.52 is relatively high. This typically implies that investors have high growth expectations for Arista Networks. Traders would compare this to industry peers (e.g., other networking or cloud infrastructure companies) and Arista’s historical P/E to assess if it’s currently overvalued or if its growth prospects justify the valuation. High P/E stocks can be more volatile.
-
Chart Pattern (1-Day): The 1-day chart shows that the stock initially rallied in the morning towards $97, then experienced a decline through the afternoon, stabilizing around the $95-$96 range by the close. This indicates a weakening during the trading day itself.
-
Volume: The screenshot does not provide specific volume data, but volume is crucial for confirming price movements. High volume on a down move can indicate strong selling pressure.
-
Technical Analysis (further):
- Support and Resistance: Traders would look for key levels where the stock has historically bounced (support) or struggled to break through (resistance). The $95-$96 range seems to be a recent area of consolidation.
- Moving Averages: Not visible here, but traders use moving averages to identify trends and potential entry/exit points.
- Trend: While the 1-day shows intraday weakness, a broader view (e.g., 1-month, 6-month, 1-year chart) would reveal the longer-term trend.
-
Fundamental Analysis:
- Company News: Any recent announcements from Arista Networks (earnings reports, product launches, partnerships, competitive developments in the networking/cloud industry) would be critical.
- Industry Trends: The demand for high-performance networking solutions, especially in data centers and cloud environments, is a key driver for Arista.
- Financial Health: A deeper dive into the company’s revenue growth, profitability, cash flow, and debt levels would provide a comprehensive picture.
Is it Right to Invest Today?
Based solely on the provided screenshot, and considering the pre-market dip and the P/E ratio, it is impossible and irresponsible to definitively say whether it is “right to invest today.” The pre-market drop suggests caution, and the high P/E implies a growth-oriented, potentially volatile stock.
Before making any investment decision, a trader should always conduct thorough due diligence, which includes:
- Up-to-date Research: Get the most current information on Arista Networks, including real-time stock prices, recent news, analyst reports, and full financial statements.
- Technical and Fundamental Analysis: Perform a deeper dive into both aspects, looking beyond a single day’s chart.
- Understanding of Risk: Be aware of the potential for loss and the specific risks associated with growth stocks and the technology sector.
- Personal Investment Goals: Ensure the investment aligns with your own financial objectives, risk tolerance, and time horizon.
- Consulting a Financial Advisor: For personalized advice, it’s always recommended to speak with a qualified financial professional.
This information is for educational purposes only and does not constitute financial advice.

