Eli Lilly and Co (LLY) stock is facing significant downward pressure heading into the new trading week, with bearish signals from both the previous session’s close and Monday’s pre-market activity. After a steep sell-off on Friday, the pharmaceutical giant appears poised for a lower open, leaving traders to question whether this is a temporary pullback or the start of a more significant correction.
This article breaks down the essential data from the latest market snapshot to help you navigate the potential volatility in Eli Lilly stock today.
Recap of a Bearish Trading Session
The 1-day chart for Eli Lilly paints a clear picture of seller dominance in the last trading session.
-
Closing Price: The stock ended the day at
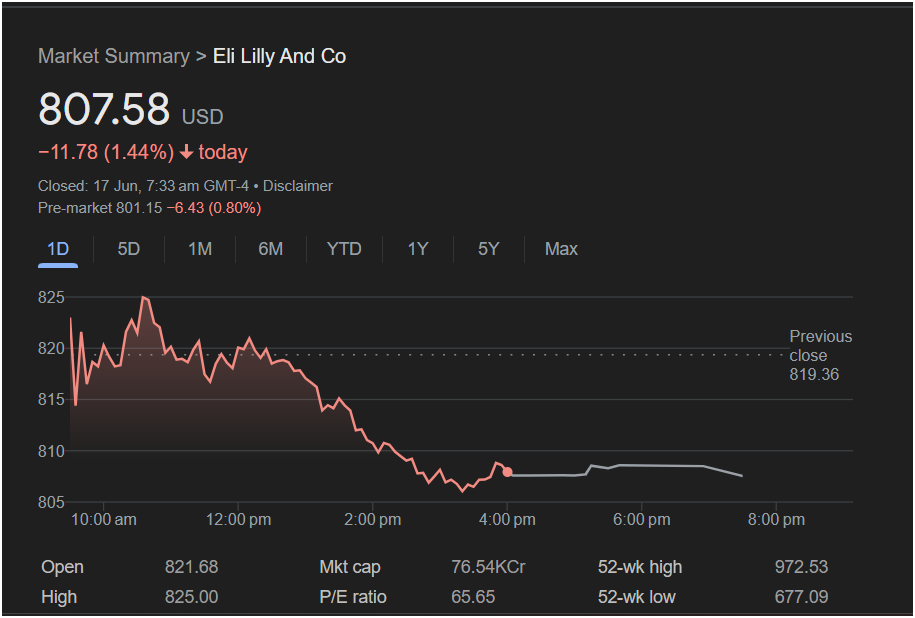 11.78 (-1.44%).
 -
Intraday Trend: The stock opened high at $821.68 and briefly touched $825.00 before embarking on a steady, day-long decline. Closing near its session low indicates that sellers were in control right up to the bell, with no late-day buying interest to prop up the price.
-
Previous Close: For context, the previous day’s close was $819.36, highlighting the scale of the drop.
Monday’s Outlook: Pre-Market Data Signals Caution
For traders preparing for Monday’s open, the pre-market data is the most critical indicator, and it reinforces the bearish trend.
As of the timestamp on the image (7:33 am GMT-4), Eli Lilly’s pre-market price stood at
This pre-market activity strongly suggests that LLY will open significantly lower on Monday, potentially breaking below the key psychological support level of $800.
Key Financial Metrics Every Trader Should Watch
Understanding the broader financial context is crucial for making an informed trading decision.
-
52-Week Range: The stock has traded between a high of
677.09. Even after the recent drop, LLY is still trading significantly above its 52-week low, reflecting a powerful long-term uptrend.
-
P/E Ratio: The Price-to-Earnings ratio is a high 65.65. This indicates that investors have priced in substantial future earnings growth. While a hallmark of successful growth stocks, a high P/E ratio can also make a stock more vulnerable to sharp corrections if market sentiment shifts.
-
Market Cap: With a market capitalization of $765.4 Billion (shown as 76.54KCr), Eli Lilly is one of the largest and most influential pharmaceutical companies in the world.
Is It the Right Time to Invest in Eli Lilly Stock?
Given the conflicting signals of a powerful long-term uptrend and a sharp short-term downtrend, here’s how to approach the stock today.
The Bearish Case (Reasons for Caution):
The immediate momentum is undeniably negative. The relentless selling on Friday, combined with a lower pre-market price, suggests the path of least resistance is down at the opening bell. A break below the $800 level could attract more sellers and lead to a test of lower support zones.
The Bullish Case (Reasons for Optimism):
Eli Lilly has been one of the market’s strongest performers, driven by the success of its weight-loss and diabetes drugs. For long-term investors, pullbacks like this can present a “buy the dip” opportunity. The stock’s fundamental story has not changed overnight, and a drop could be seen as a more attractive entry point for those with a longer time horizon.
for Traders:
For Monday, the market will be focused on the $800 support level.
-
For short-term traders: Extreme caution is advised. The prevailing trend is down. A strategy might be to wait for the stock to show signs of stabilizing or reclaiming a key level (like Friday’s close of $807.58) before considering a long position.
-
For long-term investors: This could be the start of the buying opportunity you’ve been waiting for. However, trying to catch a “falling knife” is risky. It may be prudent to see where the stock finds support before committing capital.
In summary, Eli Lilly stock is set for a challenging start to the week. While the long-term outlook remains strong, the short-term technical picture is weak, and traders should be prepared for continued volatility.
Disclaimer: This article is for informational purposes only and is based on the analysis of the provided image. It should not be considered financial advice. All investing involves risk, and you should conduct your own research or consult with a qualified financial advisor before making any investment decisions.