भिलाई: छत्तीसगढ़ के दुर्ग पुलिस ने हाईटेक तरीके से सट्टा खिलाने वाले तीन आरोपियों को गिरफ्तार किया है गिरफ्तार तीनों ही आरोपी इंजीनियरिंग के छात्र बताया जा रहे हैं। बुधवार को मुखबिर से सूचना मिलने पर की स्मृति नगर क्षेत्र के साकेत नगर में एक किराए का कमरा लेकर क्रिकेट सट्टा खिलाया जा रहा है।
सूचना पर अतिरिक्त पुलिस अधीक्षक शहर संजय कुमार धु्रव निर्देशन में साइबर सेल एंव चौकी स्मृति नगर पुलिस की टीम के द्वारा स्मृति नगर क्षेत्र में रेड कार्यवाही की गई, जिस पर तीन आरोपियों को गिरफ्तार कर उनके पास से एक लैपटाप, दो रजिस्टर , 4 नग मोबाइल, जिओ फाईवाई एवं पेटीएम एप पर 2,38,000 रुपए तथा क्रिकेट सट्टे में 8,68 258 रू का लेखा जोखा मिला है।
जिसको 63 यूपीआई एकाउट में जितेंद्र पंडित उर्फ काली के बताये अनुसार ट्रांसफर किया गया है। आरोपियों पर चार (क) जुआ एक्ट में विधिवत गिरफ्तार कर अपराध पंजीबद्ध कर कार्यवाही किया गया। प्रारंभिक पूछताछ में आरोपियों द्वारा सुपेला निवासी जितेंद्र पंडित उर्फ काली के द्वारा दिए गए रकम को अपने एंकाउट में लेकर उसके द्वारा बताये गये यूपीआई एंकाउटो में ट्रांजैक्शन भी किया गया है, जिसके संबंध में जांच की जा रही है।
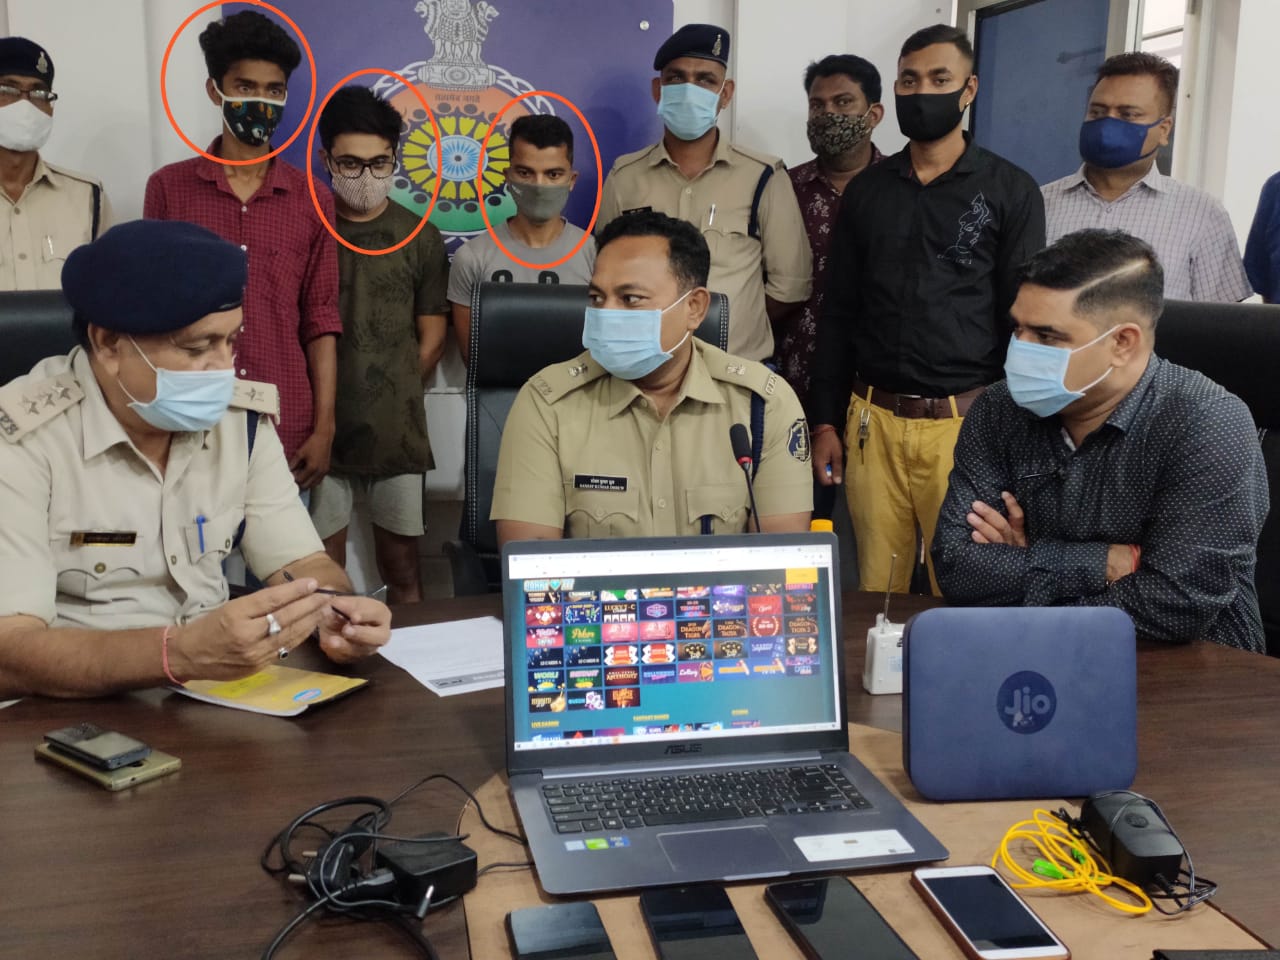
इस मामले में जितने भी ऑनलाइन के माध्यम से पैसों का लेनदेन हुआ है उनके सभी अकाउंट की जानकारी प्राप्त कर अग्रिम कार्यवाही किया जा रहा है। गिरफ्तार आरोपियों में अश्विनी कुमार पांडे पिता अमरनाथ पांडेय उम्र 24 वर्ष पता किराए का मकान-साकेत नगर स्मृति नगर (ग्राम पड़ेजी थाना आंदर जिला सिवान बिहार), तेजस पंढारे पिता अनिल पंढारे उम्र 23 वर्ष पता किराए का मकान -साकेत नगर स्मृति नगर (एसईसीएल क्वार्टर गेवरा कोरबा)
3. अतुल पटेल पिता मनोहर पटेल उम्र 30 वर्ष उम्र 23 वर्ष ग्राम पता किराए के मकान-साकेत नगर स्मृति नगर (ग्राम काशीडीह थाना डबरा जिला जांजगीर चांपा) क्रिकेट सट्टा/सट्टा एवं जुआ खेलने/खिलाने वालों के विरुद्ध दुर्ग पुलिस का यह अभियान लगातार जारी रहेगा।


