
Eli Lilly And Co (LLY) stock is setting up for a pivotal trading session on Monday after a significant sell-off on Thursday was met with a surprising rebound in pre-market activity. Investors and traders are now closely watching to see which force will prevail: the bearish momentum from the close or the bullish sentiment from early buyers. This analysis breaks down the key data points to help you navigate the potential moves for Eli Lilly’s stock.
Recap: A Day of Selling Pressure
Thursday, June 20th, was a challenging day for Eli Lilly shareholders. The stock ended the session with a notable decline, painting a bearish picture on the daily chart.
-
Closing Price: The stock closed at
6.21 (0.78%).
-
Significant Intraday Volatility: The day was marked by heavy selling pressure right from the start. After opening at
779.44** before recovering slightly. The day’s high was only $790.62, failing to reclaim the previous close of $791.24.
-
Weak Close: Finishing the day far below both its opening price and the previous day’s close suggests that sellers dominated the session.
The Bullish Twist: A Positive Pre-Market Signal
In a direct contradiction to Thursday’s weak close, the pre-market data offers a glimmer of hope for bulls.
-
Pre-Market Action: The stock is indicated at
3.56 (0.45%).
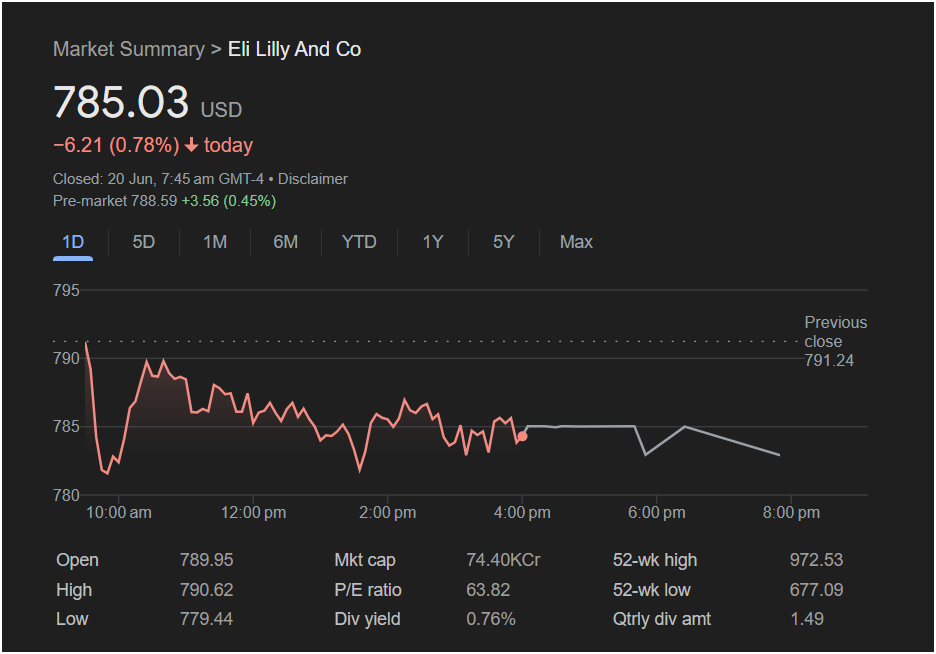
This pre-market strength suggests that some investors view Thursday’s dip as a “buy the dip” opportunity. It indicates that buyers are willing to step in at these lower levels, creating a potential battleground at the market open.
Key Levels to Watch for on Monday
The price action on Monday will likely hinge on the battle between key support and resistance levels.
-
Critical Support Level: The most important level on the downside is the session low of $779.44. If sellers push the price below this point, it could signal a continuation of the downtrend and attract more selling pressure.
-
Key Resistance Levels:
-
The first hurdle for buyers is the pre-market high around
789.95.
-
A more significant resistance area is the $791.24 level (the previous close). A move above this price would effectively erase Thursday’s losses and be a strong bullish signal.
-
Will the Stock Go Up or Down on Monday?
The conflicting signals make this a classic “wait and see” scenario.
-
The Bullish Case: If the pre-market buying momentum carries into the opening bell and the stock can break through the $790 resistance, it could signal that the sell-off was a brief pullback. The company’s high P/E ratio of 63.82 and massive market capitalization (indicated as 74.40KCr, which translates to a massive valuation approaching $900 billion) show that investors have high long-term growth expectations.
-
The Bearish Case: If the pre-market gains are quickly sold off at the open, it would suggest the bearish trend remains intact. A failure to hold above the closing price of
779.44** low would confirm that sellers are still in control.
Is It Right to Invest Today?
For traders looking at Monday’s session, this is a moment for careful consideration.
-
For Short-Term Traders: The stock is at a clear inflection point. Entering a trade before a clear direction is established is high-risk. A prudent approach would be to wait for a confirmed break above resistance (around
779.44) for a short position.
-
For Long-Term Investors: A single-day drop of less than 1% is typically insignificant for a long-term holding. This volatility could be an opportunity to add to a position at a slightly lower price, but investors should be prepared for the possibility of further downside before the stock finds a stable floor.
In conclusion, Eli Lilly stock is caught between bearish closing momentum and bullish pre-market interest. The first hour of trading on Monday will be critical. Watch the support at
791.24 to gauge which direction the stock is likely to take.
Disclaimer: This article is for informational purposes only and is based on the data provided in the image. It does not constitute financial advice. All investors should conduct their own research and consult with a financial professional before making any investment decisions.

