
Intuit Inc. (INTU) stock finished Thursday’s trading session with a solid gain, but the real story lies in the powerful buying surge that occurred just before the market close. This strong finish, pushing the stock to a higher plateau, provides a compelling bullish signal for traders heading into the next trading week.
For anyone looking to trade or invest in the financial software giant, understanding the nuances of the June 20th session is key to anticipating its next move.
Thursday’s Session Deconstructed: A Bullish Finale
Intuit closed the main trading day at
6.31 (0.84%). After the bell, the stock remained perfectly flat in after-hours trading, holding its ground at the closing price.
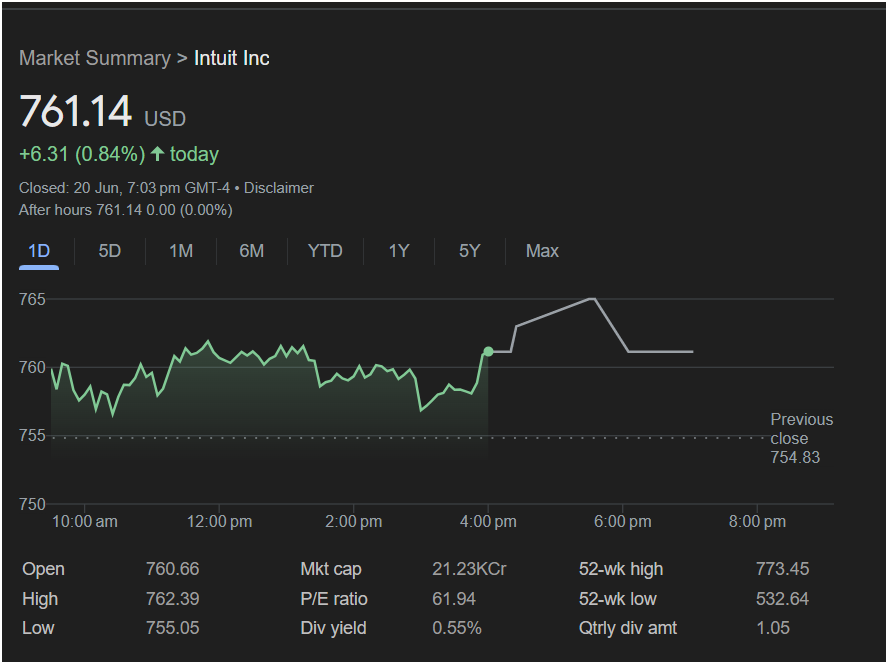
The intraday chart shows the stock trading in a relatively tight, choppy range for most of the day, oscillating between its low of $755.05 and the $762 level. However, at approximately 4:00 PM ET, a significant burst of buying activity sent the stock sharply higher, breaking out of its daily range. It then consolidated at these new, elevated levels into the close. This late-day accumulation is often a sign of institutional interest and is a powerful bullish indicator.
Key Metrics at a Glance: A Trader’s Checklist
To formulate a sound trading strategy, consider these essential data points from the June 20th close:
-
Closing Price: $761.14
-
Day’s Range: $755.05 (Low) to $762.39 (High)
-
Previous Close: $754.83
-
52-Week Range: $532.64 to $773.45
-
P/E Ratio: 61.94
-
Dividend Yield: 0.55%
The stock is currently trading very close to its 52-week high of $773.45. This confirms that Intuit is in a strong, long-term uptrend, and Thursday’s action suggests a potential attempt to retest or break that peak.
Will the Market Go Up or Down on Monday?
The evidence from Thursday’s trading overwhelmingly favors a bullish outlook for the start of the next session.
The Bullish Case (Market Up):
This is the dominant narrative. The powerful surge into the market close is the most significant signal. Stocks that close strong, especially near their daily high, often experience follow-through buying in the next session. The fact that the stock is already near its 52-week high adds to the bullish momentum. The flat after-hours trading suggests the market is comfortable with the new price and is consolidating before a potential next leg up.
The Bearish Case (Market Down):
The argument for a down move is very weak. A bear would have to hope that the late-day spike was a short-lived anomaly that will quickly fade. If the stock were to open on Monday and immediately fall back below the $760 level, it would negate the bullish signal. However, given the price action, this seems unlikely.
: Is It Right to Invest Today?
The price action on Thursday provided a clear bullish signal for Intuit stock. The late-day breakout and strong close suggest that the path of least resistance is higher.
Traders looking at Monday’s session should monitor the following key levels:
-
A move above the day’s high of $762.39 would confirm the continuation of the bullish momentum and could set the stage for a run toward the 52-week high of $773.45.
-
The
761 zone, where the breakout occurred, now acts as a key support level. As long as the stock holds above this area, the bullish outlook remains intact.
Given the strength of the late-session buying, the setup for Intuit looks promising for the week ahead.
Disclaimer: This article is for informational purposes only and is based on the analysis of a provided image. It does not constitute financial advice. Stock market trading involves significant risk, and you should conduct your own research or consult with a qualified financial advisor before making any investment decisions.

