
American Express (AXP) stock is on every trader’s watchlist this morning after closing in the red during the previous session. While yesterday’s performance showed weakness, pre-market activity is hinting at a potential bounce. For investors and traders looking to make a move, understanding the key data points and technical levels from the provided chart is crucial.
This article breaks down all the essential information from the latest American Express market summary to help you decide if today is the right day to invest.
Yesterday’s Market Recap: A Day of Volatility
American Express stock closed the last trading day at 292.81 USD, marking a loss of -1.41 (0.48%). This downward pressure tells a story of a battle between buyers and sellers where the sellers ultimately won the day.
Here’s a closer look at the key performance indicators from the session:
-
Previous Close: 294.22
-
Open: 292.09
-
Day’s High: 294.59
-
Day’s Low: 290.95
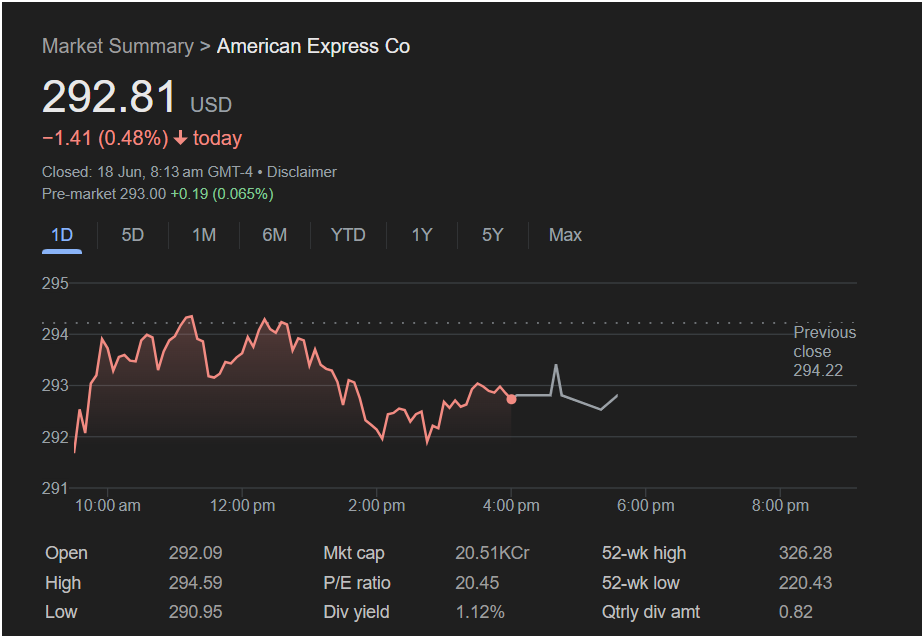 The stock opened below its previous close, attempted a rally that pushed it to a high of 294.59, but failed to sustain the momentum. It then trended downwards for most of the day, finding a bottom at 290.95 before a slight recovery into the close. The failure to hold levels above 294 indicates significant resistance.
Today’s Outlook: A Glimmer of Hope in Pre-Market
As of this morning, there’s a slight sign of optimism. The pre-market price for AXP is 293.00, showing a modest gain of +0.19 (0.065%).
This pre-market uptick suggests that there may be some buying interest before the opening bell. However, traders should be cautious. A small pre-market gain does not guarantee a positive day, but it does suggest that the stock might try to challenge the resistance levels it failed to break yesterday.
Trader’s Analysis: Key Levels and Strategy
For a trader, today’s session will be defined by a few critical price points:
-
Immediate Support: The day’s low of $290.95 is the most critical support level to watch. If the stock breaks below this level, it could signal a continuation of the downtrend.
-
Key Resistance: The area between yesterday’s high (
294.59∗∗)andthepreviousclose(∗∗294.59**) and the previous close (**294.22) acts as a major resistance zone. For the stock to regain bullish momentum, it needs to decisively break through and hold above this level.
Will the stock go up or down?
Based on the conflicting signals—a negative closing trend versus a slightly positive pre-market—today is shaping up to be a pivotal day for American Express stock.
-
A Bullish Case (Up): If the market opens and buyers step in, pushing the price above the $294.59 resistance, it could signal a reversal and attract more buyers. The positive pre-market data supports this potential.
-
A Bearish Case (Down): If the stock fails to overcome the initial resistance and falls below the $290.95 support, the downward momentum from yesterday is likely to continue.
The Bigger Picture: Is AXP a Good Investment?
Looking beyond the one-day chart, here are some fundamental metrics for a long-term view:
-
52-Week Range: The stock is trading between a low of $220.43 and a high of
326.28.Itscurrentpriceof 326.28. Its current price of ~293 places it in the upper end of its yearly range, indicating strong performance over the past year.
-
P/E Ratio: At 20.45, the price-to-earnings ratio gives a snapshot of the company’s valuation.
-
Dividend Yield: For income-focused investors, the 1.12% dividend yield (quarterly dividend of $0.82) offers a steady return.
: Should You Invest Today
Investing today comes with elevated risk due to the uncertainty. The stock is at a crossroads.
-
For Aggressive Traders: An opportunity may exist to buy near the support level of $290.95 with a tight stop-loss, or to short the stock if it fails at the $294 resistance.
-
For Cautious Investors: It may be wise to wait for a clear trend to emerge. A confirmed break above $295 or a drop below $290 would provide a clearer signal for your next move.
The first hour of trading will be critical in setting the tone for the rest of the day. Watch these key levels closely.
Disclaimer: This article is for informational purposes only and is based on the data provided in the screenshot. It does not constitute financial advice. All investors should conduct their own research and consult with a professional financial advisor before making any investment decisions.

