खैरागढ़: भाजपा विधायक एवं पूर्व मंत्री बृजमोहन अग्रवाल ने कहा कि किसान, नौजवान, वृद्ध, परित्यक्ताओ का पैसा खाने वाली काँग्रेस को इस उप चुनाव में सबक सिखाएं और कमल फूल में बटन दबा कर भाजपा प्रत्याशी कोमल जंघेल को विजयी बनाएँ।
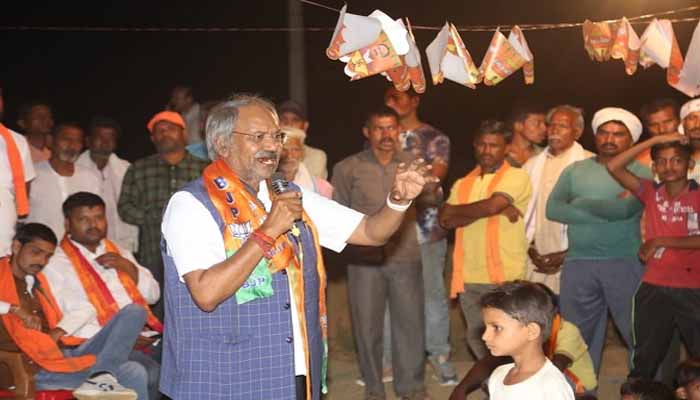
बृजमोहन अग्रवाल शुक्रवार को खैरागढ़ विधानसभा क्षेत्र में ग्रामीण सभाओं को सम्बोधित कर रहे थे। उन्होंने कहा कि किसानों से काँग्रेस ने 2500 रुपये में धान खरीदी की है उस समय धान का समर्थन मूल्य 1650 रुपये था।
अब धान का समर्थन मूल्य 1980रुपये है लेकिन काँग्रेस अभी भी 25 सौ रुपये पर धान खरीदी कर रही है। यानी यह सरकार 330 रुपये कम दे रही है। 15 क्विंटल के हिसाब से प्रत्येक किसान का पांच हजार रुपये का डाका ये भूपेश सरकार डाल रही है। उन्होंने कहा कि इस पर भी पिछले साल की धान खरीद की चौथी किस्त में 30 प्रतिशत की कटौती कर पैसा कम दिया गया है।
विधायक अग्रवाल ने कहा कि काँग्रेस ने वादा किया था की हम सरकार में आए तो 10 लाख रोजगार देंगे नहीं तो 2500 रुपये बेरोजगारी भत्ता देंगे। इस तरह पिछले 42 महीनों का हिसाब जोड़े तो यह सरकार हर नौजवान के लाख रुपये का डाका डाला है। उन्होंने कहा कि इसी तरह काँग्रेस का वादा था कि निराश्रित, वृद्धावस्था और परित्यक्ताओ की पेंशन को बढ़ा कर 1000 और 1500 रुपये करेंगे, लेकिन उन्होंने नहीं किया इस तरह उन्होंने उन्हें भी ठगा है। जनता इन सभी का बदला इस उप चुनाव में लेगी।
उन्होंने कहा कि प्रधानमन्त्री मोदी गरीबों की चिंता करते हुए प्रधानमंत्री आवास और नल से घर-घर पानी देने के लिए पैसे भेज रहे हैं लेकिन भूपेश सरकार उसे वापस कर रही है।
काँग्रेस को गरीबों की चिंता नहीं है। उन्होंने कहा कि भाजपा पार्टी गरीबों की चिंता करने वाली है कमल फूल की सरकार में 1 रुपये में चावल देने की योजना लाई, शौचालय और मुफ्त गैस कनेक्शन मिलता था। अब नहीं मिल रहा है।हमारे समय में प्रधानमंत्री सड़क योजना से गाँव गाँव में सडक बनी थी आज उनकी हालत खराब है सरकार उसकी रिपेयरिंग तक नहीं कर पा रही है।
अग्रवाल ने कहा कि खैरागढ़ में हमने 5 हजार करोड़ के विकास का काम किया है। भूपेश सरकार बताए कि उसने क्या 1रुपये का भी विकास खैरागढ़ के लिए किया है। इसके बदले काँग्रेस ने ऐसे प्रत्याशी को टिकट दिया है जिस पर गाँव वालों का आरोप है कि उसने खाद की कालाबाजारी की है।
अब जो अभी आपकी ऋण पुस्तिका लेकर ब्लैक में खाद बेच सकती है वो जीतने के बाद क्या करेगी, इसे सोचना पड़ेगा। वहीं भाजपा प्रत्याशी कोमल जंघेल सीधे सरल और मिलनसार हैं। श्री अग्रवाल ने कहा कि खैरागढ़ की जनता अब निर्णय ले चुकी है कि इस लबरा सरकार को सबक सिखाएंगे और कमल फूल को जिताएगे।


