For traders keeping a close eye on Apple Inc. (NASDAQ: AAPL), the latest market data presents a mixed but crucial picture. Following a session of notable decline, the pre-market activity suggests potential for a rebound. This article breaks down all the essential information from the latest Apple stock chart to help you form a strategy for the trading day ahead.
Yesterday’s Market Recap: A Bearish Close
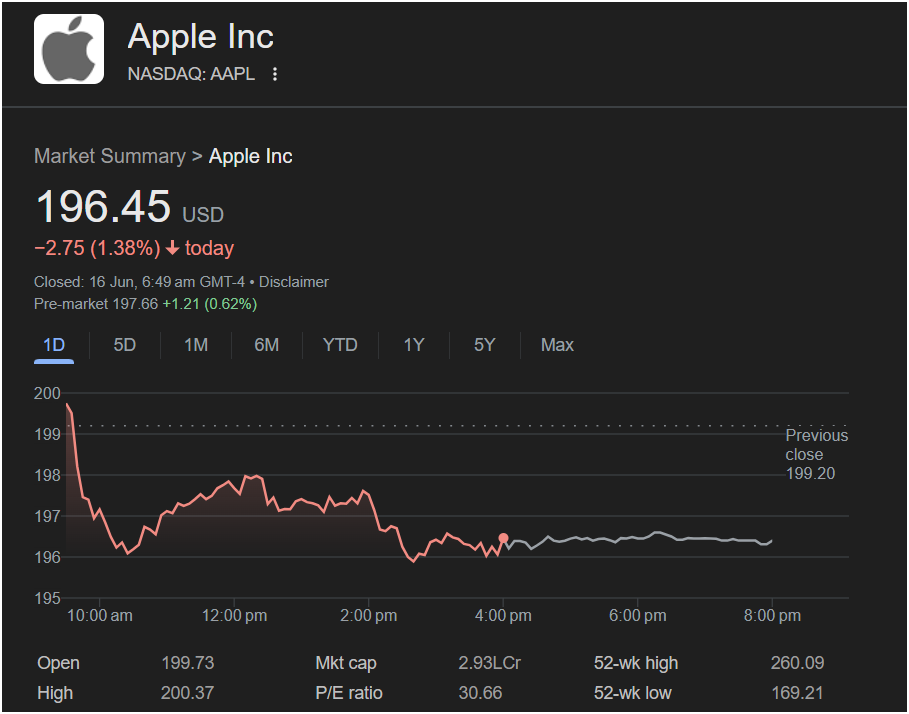
The most prominent figures from the last trading session paint a clear picture of a downturn:
-
Closing Price: Apple stock closed at 196.45 USD.
-
Daily Change: The stock fell by -2.75 points, which represents a -1.38% decline for the day.
-
Market Status: The data is from a closed session on June 16th.
The daily chart shows significant volatility. The stock opened strong at 199.73, briefly hitting a high of 200.37. However, it quickly faced selling pressure, dropping sharply in the first hour of trading. After a period of consolidation in the 197-198 range, it saw another dip into the close, finishing near its intraday low. This weak close suggests that sellers were in control by the end of the session.
Pre-Market Signals: A Potential Reversal?
Despite the negative close, the pre-market data offers a glimmer of optimism for the upcoming session:
-
Pre-Market Price: 197.66 USD
-
Pre-Market Gain: +1.21 (0.62%)
This positive pre-market activity indicates that buying interest is emerging before the opening bell. Traders will be watching to see if this momentum can carry through into the main trading session and challenge the resistance levels established during the previous day’s decline.
Key Financial Metrics for Context
To understand the bigger picture, it’s essential to look beyond the one-day chart:
-
Market Cap: 2.93L Cr (equivalent to 2.93 Trillion USD), reaffirming Apple’s status as one of the world’s largest and most influential companies.
-
P/E Ratio: At 30.66, the Price-to-Earnings ratio gives an indication of the stock’s valuation relative to its earnings. Traders may compare this to industry averages to gauge if the stock is over or undervalued.
-
52-Week Range: The stock has traded between 169.21 USD (low) and 260.09 USD (high) over the past year. The current price of 196.45 sits comfortably above the low but is significantly off its peak, indicating room for movement in either direction.
 Trader’s Outlook: Should You Invest Today?
Based on the available data, here are the key takeaways and levels for traders to watch:
The Bullish Case (Reasons for Optimism):
-
The pre-market gain of over 0.60% suggests initial buying pressure.
-
The stock is trading significantly higher than its 52-week low, indicating strong long-term fundamentals.
The Bearish Case (Reasons for Caution):
-
The stock experienced a significant 1.38% drop in the previous session.
-
It failed to hold the psychological $200 level and closed weak, near the day’s low.
-
The Previous Close of 199.20 will now act as a major resistance level.
Key Levels to Monitor:
-
Immediate Support: The intraday low around 196.00. A break below this level could signal further downside.
-
Immediate Resistance: The pre-market high around 197.66 and the previous day’s consolidation area near 198.00.
-
Major Resistance: The 199.20 (previous close) to 200.37 (day’s high) zone will be a critical test for bulls.
:
The decision to invest in Apple stock today depends on your trading strategy and risk tolerance. The conflict between a bearish previous session and bullish pre-market activity suggests potential for volatility.
A conservative trader might wait to see if the stock can decisively break and hold above the
196 support level could present a shorting opportunity.
Disclaimer: This article is for informational purposes only and is based on the data provided in the image. It does not constitute financial advice. Stock market trading involves significant risk, and you should conduct your own research and consult with a qualified financial advisor before making any investment decisions.