Disclaimer: This article is for informational and educational purposes only. It is not financial advice. The information presented is based on a snapshot in time and should not be used as the sole basis for any investment decisions. Always conduct your own thorough research and consult with a qualified financial advisor before investing.
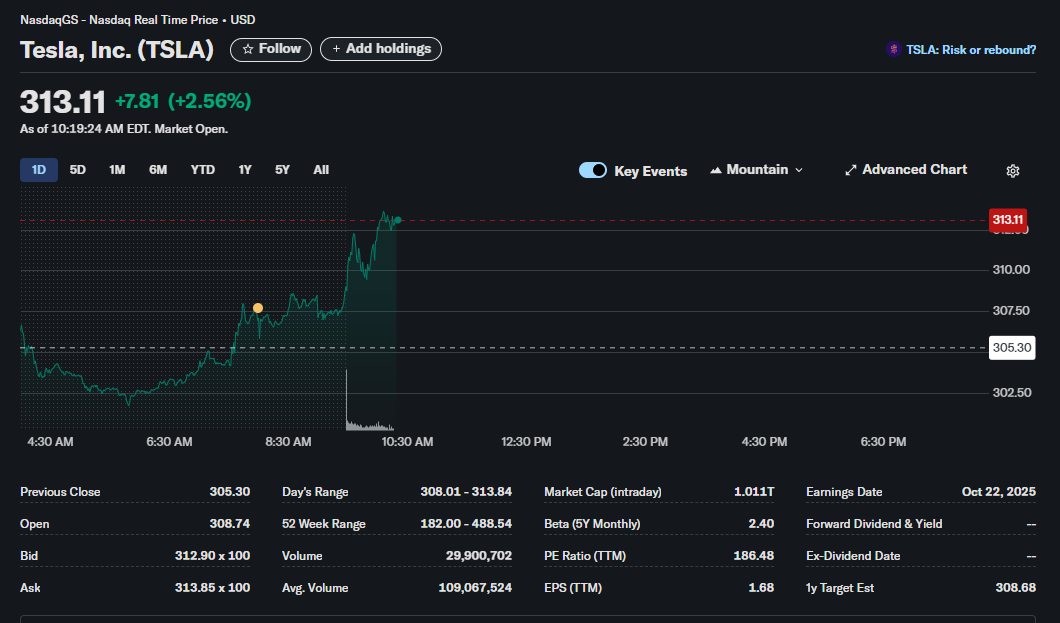
Tesla, Inc. (NASDAQ: TSLA) is experiencing a significant upward movement in today’s trading session, capturing the attention of investors. With the stock price climbing to $313.11, a gain of over 2.5%, it’s crucial to look beyond the numbers and analyze what may be driving this momentum. Here’s a breakdown using technical, fundamental, and sentiment analysis based on the available data.
Technical Analysis: Bullish Momentum on High Volume
Technical analysis focuses on chart patterns, price action, and trading volume to forecast future price movements. The current chart for TSLA displays several bullish short-term signals.
-
Price Breakout: The most prominent feature is the sharp price increase that began around the market open at 9:30 AM EDT. The stock moved decisively above its previous closing price of $305.30, which had acted as a level of resistance in the pre-market hours.
-
Volume Spike: Corresponding with the price breakout is a significant spike in trading volume. High volume on a price increase is often interpreted as a sign of strong conviction from buyers, adding credibility to the upward trend. While the intraday volume of ~29.9 million is still below the average volume of ~109 million, the concentration of this volume during the rally is a key bullish indicator for the session.
-
Trend: The intraday trend is unequivocally upward. The stock has consistently set higher highs and higher lows throughout the morning, indicating strong buying pressure is currently outweighing selling pressure. The current intraday high of $313.84 serves as the immediate resistance level to watch.
Fundamental Analysis: The High-Growth, High-Risk Picture
Fundamental analysis examines a company’s underlying financial health and valuation to determine its intrinsic worth. The provided data offers a snapshot of Tesla’s key fundamentals.
-
Valuation (P/E Ratio): Tesla’s Price-to-Earnings (P/E) ratio is 188.48. This is a very high P/E ratio compared to the broader market average, indicating that investors are willing to pay a significant premium for each dollar of Tesla’s earnings. This high valuation is typical for companies with strong future growth expectations but also suggests that the stock could be vulnerable to corrections if growth fails to meet these high expectations.
-
Volatility (Beta): With a 5-year monthly Beta of 2.40, TSLA is significantly more volatile than the market as a whole (where a Beta of 1.0 represents market volatility). This means investors can expect wider price swings—both up and down—than the S&P 500, making it a higher-risk, higher-potential-reward investment.
-
Company Size and Profitability: A market capitalization of 1.68 confirms that the company is profitable on a trailing twelve-month basis.
-
Dividends: Tesla does not offer a dividend, which is common for growth-oriented technology companies that prefer to reinvest profits back into research, development, and expansion.
Sentiment Analysis: Intraday Optimism vs. Broader Caution
Sentiment analysis gauges the overall mood or feeling of investors towards a stock. The current sentiment appears to be a mix of short-term excitement and long-term debate.
-
Intraday Sentiment: The powerful price rally and high buying volume strongly suggest that intraday market sentiment is overwhelmingly bullish. Traders are actively buying the stock, driving its price higher.
-
Analyst Consensus: The 1-year target estimate is $308.68. Interestingly, the current price of $313.11 has surpassed this average analyst target. This could imply that the current rally is driven by recent news or momentum not yet fully reflected in analyst models, or that the stock may be getting ahead of its perceived long-term value.
-
Market Narrative: A subtle but important clue on the chart is the tag “TSLA: Risk or rebound?”. This perfectly encapsulates the divided sentiment surrounding the stock. While some see the current price action as a strong “rebound,” others remain cautious about the inherent “risks” associated with its high valuation and volatility.
In conclusion, today’s trading action for TSLA showcases a stock with strong bullish technical momentum. However, this is set against a backdrop of a high-risk, high-valuation fundamental profile and a broader market sentiment that remains divided on its long-term prospects.