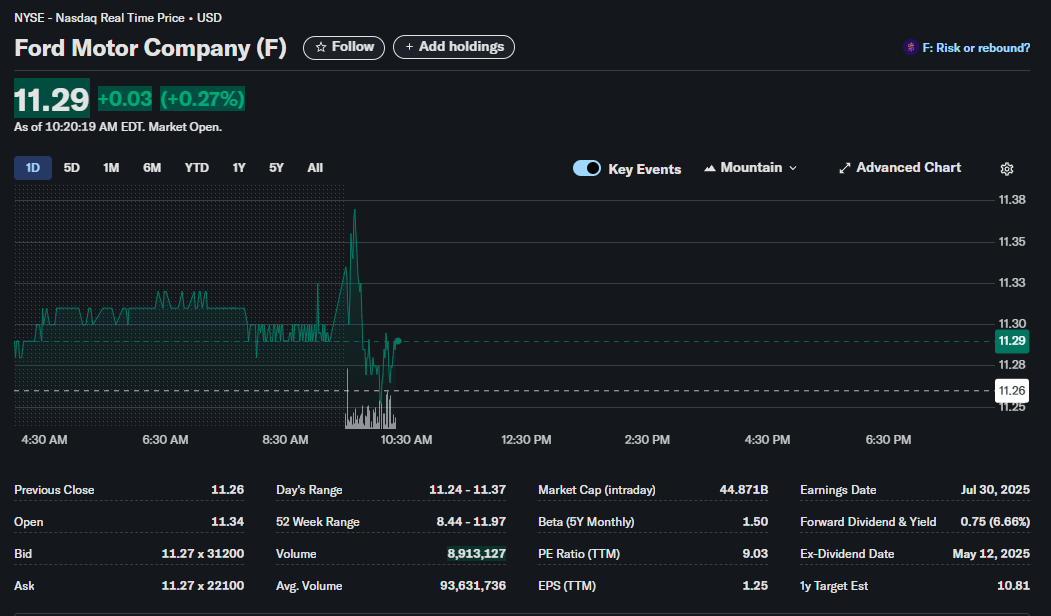
Ford Motor Company (NYSE: F) experienced a volatile start to the trading day, with its stock price swinging sharply after the market opened. An analysis of its intraday performance and key financial metrics reveals a complex picture, highlighting short-term technical patterns, an attractive fundamental profile for income investors, and mixed sentiment from the broader market.
Here is a comprehensive breakdown based on the data available as of 10:20 AM EDT.
Technical Analysis: A Battle at Key Levels
Technical analysis focuses on chart patterns, price action, and volume to predict future movements. The intraday chart for Ford (F) shows a classic example of morning volatility.
-
Intraday Price Action: The stock gapped up slightly at the open (11.26). It then spiked to a session high of 11.24. This sharp V-shaped reversal indicates a significant battle between buyers and sellers right at the market’s start.
-
Key Support and Resistance: The day’s low of 11.37 acts as short-term resistance. The stock is currently attempting to stabilize above the previous day’s close, a psychologically important level for traders.
-
Volume Indicator: A massive spike in volume is visible precisely at 9:30 AM, corresponding with the sharp price movements. This confirms that the initial volatility was driven by a high number of trades, suggesting a strong reaction to pre-market news or a large institutional order. Today’s volume of 8.9 million shares, while still early in the day, shows significant initial interest.
-
Volatility (Beta): With a 5-year monthly Beta of 1.50, Ford’s stock is historically 50% more volatile than the S&P 500. The morning’s price action is a clear reflection of this higher-than-average volatility.
Fundamental Analysis: The Case for Value and Income
Fundamental analysis examines a company’s financial health and valuation to determine its intrinsic worth. Based on the provided data, Ford presents a compelling case for value-oriented and income-seeking investors.
-
Valuation (P/E Ratio): Ford’s Price-to-Earnings (P/E) ratio is 9.03. A P/E ratio below 10 is often considered low, suggesting that the stock may be undervalued relative to its earnings over the past twelve months.
-
Profitability (EPS): The company has a positive Earnings Per Share (EPS) of $1.25, indicating solid profitability on a per-share basis.
-
Dividend Yield: The most striking fundamental metric is the Forward Dividend & Yield of $0.75 (6.66%). A yield of this magnitude is significantly higher than the market average, making Ford (F) an attractive option for investors looking to generate regular income from their portfolio.
-
Future Catalyst: The next major fundamental event for the company is its Earnings Date on July 30, 2025, when investors will get an updated look at the company’s financial performance.
Sentiment Analysis: A Market Divided
Sentiment analysis gauges the overall mood of investors and analysts toward a stock. For Ford, the sentiment appears to be mixed and leaning towards cautious.
-
Analyst Outlook: The 1-year analyst target estimate is $10.81. This is notably below the current trading price of $11.29. This bearish-to-neutral consensus from analysts suggests that the professional community, on average, does not expect significant price appreciation in the near term.
-
Bid-Ask Spread: The bid (11.27 x 22,100) are tight, indicating high liquidity and active trading. The slightly larger number of shares on the bid side at this price point hints at solid demand, but this can change rapidly.
-
Platform-Driven Sentiment: The trading platform itself poses the question, “F: Risk or rebound?” This framing directly captures the current market debate. Investors are weighing the risk of a further downturn (as suggested by analyst targets) against the potential for a rebound from the morning’s low.
In summary, Ford (F) presents a dual narrative: its fundamental metrics, particularly its high dividend yield and low P/E ratio, are attractive, while its technical volatility and cautious analyst sentiment call for a measured approach.
Disclaimer: This article is for informational purposes only and is based on a snapshot of stock data at a specific point in time. It does not constitute financial advice, a recommendation to buy or sell securities, or a solicitation of any kind. Investors should conduct their own research and consult with a qualified financial professional before making any investment decisions.