Dow Inc. (DOW) Stock Analysis: Price Dips Below $25 on High Volume, What Traders Need to Know
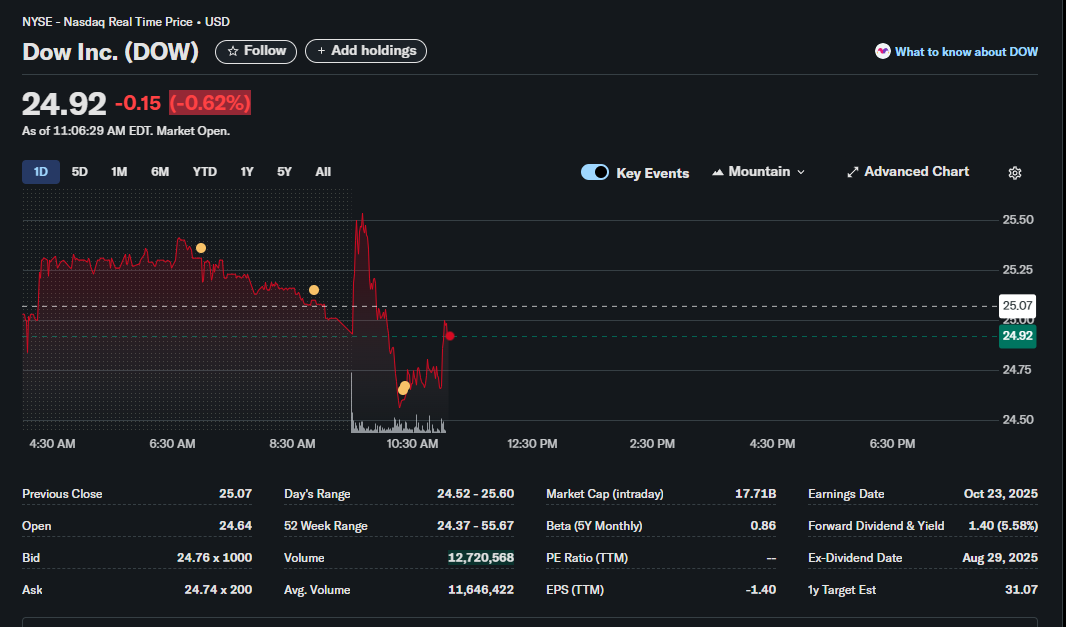
Dow Inc. (Ticker: DOW), a cornerstone of the materials science sector, is experiencing a volatile trading session today. As of 11:06 AM EDT, the stock is trading at 0.15 (0.62%). This analysis breaks down the real-time data to provide traders with a comprehensive view of the stock’s current performance, key financial metrics, and potential trading considerations.
Key Takeaways from Today’s Trading Session
-
Significant Intraday Volatility: The stock experienced a sharp sell-off at the market open, pushing the price to its daily low.
-
Elevated Trading Volume: Current volume is tracking above the daily average, indicating strong interest and conviction behind the price movement.
-
Price Near 52-Week Low: The current price of $24.92 is approaching the 52-week low of $24.37, a critical technical level to watch.
-
Strong Dividend Yield: Despite the price drop, Dow Inc. offers a very attractive forward dividend yield of over 5.5%, a key point for income-focused investors.
-
Negative Recent Earnings: The company’s trailing twelve months (TTM) Earnings Per Share (EPS) is negative, indicating a recent lack of profitability.
-
Bullish Analyst Outlook: The one-year analyst target estimate of $31.07 suggests significant potential upside from the current price level.
Detailed Intraday Price Action and Technical Analysis
The 1-day chart reveals a story of significant selling pressure. After opening at $24.64, lower than the previous close of $25.07, the stock saw a brief spike before a steep decline initiated around 9:30 AM EDT. This sell-off was accompanied by a substantial spike in volume, a classic sign that the move has significant bearish momentum.
The price found a bottom at the day’s low of $24.52 and has since attempted a minor recovery. For a trader, several points are crucial:
-
Support Level: The price is currently trading very close to its 52-week low ($24.37). This level could act as a strong area of support. A break below this level on high volume could signal further downside. Conversely, a bounce from this level could present a buying opportunity for contrarian traders.
-
Resistance Level: The previous day’s close of $25.07 now acts as an initial resistance level. Any recovery will need to reclaim this price point to regain short-term bullish momentum.
-
Volume Confirmation: Today’s volume is 12,720,568 shares, already surpassing the average volume of 11,646,422. This high volume validates the significance of the downward price action.
Fundamental Financial Health: A Mixed Picture
A trader must look beyond the chart to the underlying company fundamentals.
| Metric | Value | Trader’s Interpretation |
| Market Cap (Intraday) | $17.71B | Dow Inc. is a large-cap company, generally implying more stability and liquidity compared to smaller companies. |
| PE Ratio (TTM) | — | Not applicable due to negative earnings. This means the company was not profitable over the last 12 months. |
| EPS (TTM) | -$1.40 | The negative Earnings Per Share confirms the lack of recent profitability, which is a key factor behind the stock’s weak performance. |
| Beta (5Y Monthly) | 0.86 | With a Beta below 1, DOW is historically less volatile than the broader market (e.g., the S&P 500). Today’s action is an exception to its typical behavior. |
| 52 Week Range | $24.37 – $55.67 | The current price is at the extreme low end of this range, highlighting the stock’s significant decline over the past year. |
Shareholder Returns and Future Outlook
This is where the picture becomes more nuanced for potential investors.
-
Forward Dividend & Yield: 1.40 (5.58%)
This is a significant positive. A 5.58% yield is very high and can attract income-seeking investors, potentially creating a “floor” for the stock price as the yield becomes more attractive on price dips. -
1y Target Est: $31.07
Wall Street analysts, on average, project the stock to reach $31.07 within the next year. This represents a potential upside of over 24% from the current price. This suggests that analysts believe the company’s long-term prospects are stronger than its current price reflects.
Key Dates for Your Calendar
-
Ex-Dividend Date: Aug 29, 2025
To be eligible for the next dividend payment, an investor must own the stock before this date. This is a critical date for dividend-capture strategies. -
Earnings Date: Oct 23, 2025
This is the next scheduled earnings report. Expect heightened volatility around this date as the market reacts to new information about the company’s profitability, revenue, and future guidance.
Conclusion for Traders and Investors
Dow Inc. (DOW) currently presents a classic “value vs. momentum” dilemma.
-
The Bearish Case: The stock is in a clear short-term and long-term downtrend. Negative earnings and strong selling pressure are significant headwinds. Momentum traders would likely see this as a stock to avoid or potentially short, especially if it breaks the 52-week low.
-
The Bullish Case: The stock is trading near a major support level, boasts a highly attractive dividend yield, and has a bullish one-year analyst price target. Value and income-focused investors might see this as an opportunity to acquire a large-cap industry leader at a discounted price, betting on a long-term recovery and collecting a substantial dividend while they wait.
Final Actionable Strategy: Traders should closely monitor the $24.37 support level. A decisive break below could lead to further decline. A strong bounce off this level, especially on increasing volume, could signal a short-term bottom has been formed. For any position, understanding the upcoming earnings and ex-dividend dates is crucial for risk management and strategy planning.
Disclaimer: This article is for informational and educational purposes only. It is not financial advice. The information presented is based on a data snapshot at a specific point in time and is subject to change. All trading and investment decisions carry risk, and you should conduct your own research and consult with a qualified financial advisor before making any decisions.