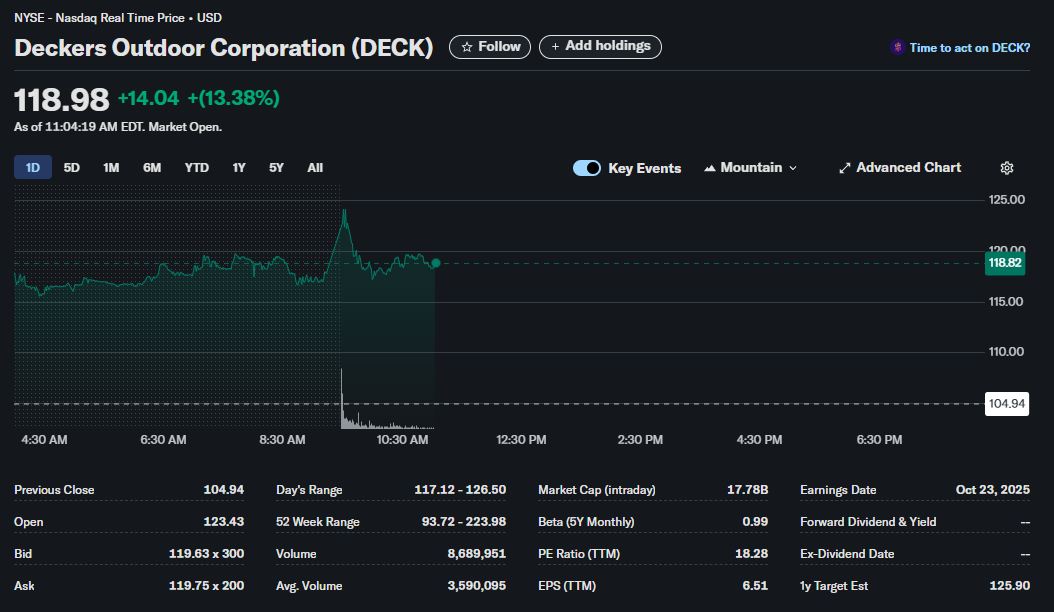
Deckers Outdoor Corporation (NYSE: DECK) experienced a significant and volatile trading session, with its stock price surging by over 13%. For traders and investors watching the ticker, such a dramatic move warrants a closer look. This analysis breaks down the key data points from the trading session to provide a comprehensive understanding of what happened and what these metrics could signify for future price action.
The Main Event: Deconstructing the Price Action
The most striking feature of the day was the explosive upward movement in DECK’s stock price.
-
Current Price (as of 11:04 AM EDT): $118.98
-
Day’s Gain: +$14.04 (+13.38%)
This represents a substantial single-day gain, immediately catching the attention of the market. Let’s analyze the context:
-
Gap Up at Open: The stock opened at 104.94. This is known as a “gap up,” which typically occurs on the back of major positive news released after market hours or before the market opens, such as a strong earnings report, a product announcement, or an analyst upgrade.
-
Intraday Volatility: The Day’s Range of $117.12 – $126.50 reveals significant volatility. After gapping up and hitting a high of $126.50, the price pulled back to the $118 level. This wide range presents opportunities for day traders but also signals increased risk.
-
Massive Volume Spike: The Volume for the session stood at 8,689,951 shares traded. This is more than double the Average Volume of 3,590,095. Such high volume confirms the significance of the price move. It indicates strong interest and conviction from institutional and retail traders, validating the catalyst behind the surge.
A Trader’s Dashboard: Key Financial Metrics Explained
Beyond the price chart, the underlying financial metrics provide crucial context for evaluating DECK’s current standing.
| Metric | Value | What It Tells A Trader |
| Market Cap (intraday) | $17.78B | This places Deckers in the large-cap category, suggesting a well-established company with a significant market presence. |
| P/E Ratio (TTM) | 18.28 | The Price-to-Earnings ratio suggests investors are paying $18.28 for every $1 of the company’s past year’s earnings. This is a key valuation metric. Whether it’s high or low depends on its industry peers and its own historical average. |
| EPS (TTM) | $6.51 | Earnings Per Share (Trailing Twelve Months) shows the company’s profitability on a per-share basis over the last year. A positive EPS is a fundamental sign of health. |
| Beta (5Y Monthly) | 0.99 | A beta very close to 1.0 indicates that DECK’s stock price, over the last 5 years, has moved almost in tandem with the overall market (e.g., the S&P 500). It is not considered significantly more or less volatile than the broader market on a long-term basis, though single-day events can cause short-term spikes in volatility. |
| 52 Week Range | $93.72 – $223.98 | The current price of ~$119 is in the lower half of its 52-week range, suggesting that even with this surge, the stock is trading well below its recent yearly highs. This could be viewed as either a potential for further recovery or a sign of a longer-term downtrend that is now seeing a reversal. |
| 1y Target Est | $125.90 | The average 1-year price target from analysts is just below the day’s high of $126.50. This could imply that, in the view of some analysts, the stock is approaching its fair value after this jump. Traders should watch for any new analyst reports or target revisions following this price action. |
| Forward Dividend & Yield | — | Deckers does not currently pay a dividend. This is common for companies focusing on growth, as they prefer to reinvest earnings back into the business. Investors in DECK are seeking capital appreciation, not income. |
| Earnings Date | Oct 23, 2025 | This date appears to be an anomaly or data error, as it’s unusually far in the future. Traders should verify the next official earnings date from a reliable source, as earnings announcements are major catalysts for stock price movement. |
Putting It All Together: What Does This Mean for Your Strategy?
Different types of market participants will interpret this information differently.
For the Day Trader:
-
Opportunity: The high volume and wide intraday range offer significant opportunities for profit.
-
Key Levels to Watch: The day’s high (117.12) are critical short-term resistance and support levels. The opening price (104.94) are also psychologically important levels.
-
Strategy: Look for consolidation patterns after the initial move. Trading breakouts or breakdowns from these tight ranges on high volume could be a viable strategy.
For the Swing Trader:
-
The Gap is Key: The large gap up between $104.94 and $123.43 is the most important feature. Swing traders will watch to see if this is a “breakaway gap” (signaling the start of a new uptrend) or an “exhaustion gap” that may get “filled” (price drops back down to close the gap).
-
Confirmation Needed: A swing trader would likely wait for the next few trading days to see if the price can hold above the gap-up level. A close above the day’s high ($126.50) in the coming days would be a strong bullish signal.
For the Long-Term Investor:
-
Focus on the “Why”: The one-day surge is less important than the fundamental reason behind it. Was it a blowout earnings report that changes the company’s long-term outlook? A new, game-changing product line? An investor must investigate the catalyst.
-
Valuation is Crucial: The P/E ratio of 18.28 should be compared against competitors in the footwear and apparel industry. The 52-week range shows there has been significant downward pressure on the stock over the past year. The key question is whether this event marks a true fundamental turning point for the company.
Conclusion: A Bullish Day, But Due Diligence is Paramount
The data clearly shows a powerful, bullish day for Deckers Outdoor Corporation, driven by a significant catalyst that attracted immense volume. The stock showed strong momentum, breaking through previous levels with conviction.
However, a single day does not define a trend. Traders and investors must now exercise diligence. The most critical next step is to identify the specific news that caused this surge. From there, one can analyze whether the market’s reaction is justified and if the momentum has the potential to continue. Watch key technical levels for short-term direction and dig into the fundamentals to determine if this is the start of a new chapter for DECK.
Disclaimer: This article is for informational and educational purposes only. It is not financial advice. The information presented is based on a specific snapshot in time and should not be considered a recommendation to buy, sell, or hold any security. All trading and investment decisions carry risk, and you should consult with a qualified financial professional before making any decisions.