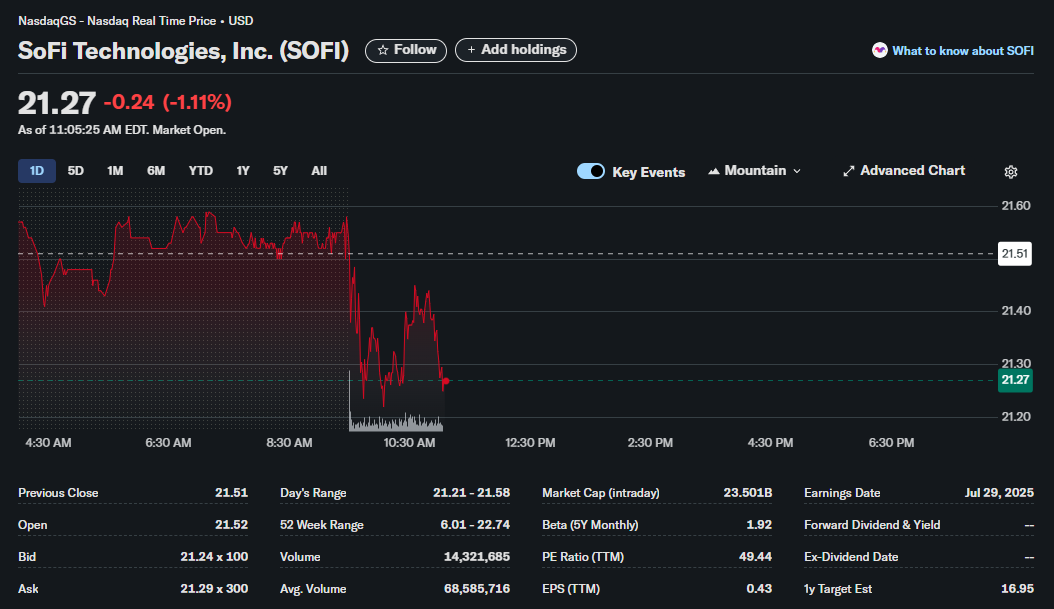
SoFi Technologies, Inc. (NASDAQ: SOFI) is experiencing a notable intraday downturn, catching the attention of active traders. As of 11:05:25 AM EDT, the stock is trading at 0.24 or 1.11% for the session. This article provides a detailed breakdown of the current technical picture, key financial metrics, and potential levels that traders should be watching.
Today’s Intraday Price Action: A Sharp Sell-Off at the Open
A close look at the 1-day chart reveals a story of two distinct periods in today’s session so far:
-
Pre-Market & Early Stability: The stock initially traded in a tight range around the previous day’s close of $21.51, even opening slightly higher at $21.52. This suggested a potentially stable or bullish start to the day.
-
The 9:30 AM Plunge: Coinciding with the market open, SoFi experienced a significant and sharp sell-off. The price dropped from the $21.50s to below $21.30 in a very short period.
-
Current Consolidation: Following the drop, the stock has been attempting to find a floor, trading in a volatile but narrow range between its day’s low and the $21.40 level. The current price of $21.27 is hovering very close to the session’s low.
This pattern suggests that selling pressure overwhelmed early buying interest at the market’s open, a crucial time for price discovery.
Key Financial Metrics: What Traders Need to Know
The provided data offers critical context beyond the price chart. Here’s a breakdown of the most important metrics for traders.
| Metric | Value | Trader’s Takeaway |
| Day’s Range | $21.21 – $21.58 | These are the immediate, hard lines of support and resistance for the current session. A break below $21.21 could signal further downside, while a reclaim of $21.58 would be a strong bullish signal for the day. |
| 52 Week Range | $6.01 – $22.74 | This is highly significant. The current price is near the top of its 52-week range, indicating the stock has had a phenomenal run. Trading near a 52-week high can often act as a major resistance level as long-term holders may look to take profits. |
| Beta (5Y Monthly) | 1.92 | With a beta nearing 2.0, SoFi is significantly more volatile than the overall market (represented by a beta of 1.0). This means traders can expect larger price swings in both directions. It’s a high-risk, high-reward characteristic. |
| Volume | 14.3M | Compared to Avg. Volume of 68.5M, today’s volume is relatively light so far. This could mean the sell-off lacks strong conviction, but traders should watch if volume picks up as the day progresses, which would validate the downward move. |
| PE Ratio (TTM) | 49.44 | A P/E ratio of nearly 50 is high, indicating that investors have strong growth expectations priced into the stock. This can make the stock more sensitive to negative news or failure to meet those high expectations. |
| 1y Target Est | $16.95 | This is arguably the most critical bearish indicator on the report. The average 1-year analyst price target is significantly below the current trading price. This suggests that, on average, market analysts believe the stock is currently overvalued and has potential for a significant correction over the next year. |
| Forward Dividend | — | SoFi is a growth-oriented company and does not pay a dividend. Investors are purely focused on capital appreciation. |
Technical Analysis and Key Levels to Watch
For traders looking to make a move, identifying key price levels is essential.
Support Levels:
-
Immediate Support: The day’s low at $21.21 is the first critical level to watch. A firm break and hold below this could trigger further stop-loss orders and accelerate selling.
-
Psychological Support: The $21.00 mark serves as the next psychological support level.
-
Major Support: While not on the 1-day chart, a look at a longer-term chart would be necessary to identify the next major support zones, but the significant gap between the current price and the 1-year target of $16.95 suggests there could be substantial room to fall if a downtrend is confirmed.
Resistance Levels:
-
Immediate Resistance: The price area just before the morning plunge, around $21.51 (Previous Close), now acts as a strong intraday resistance. A move back above this level would be the first sign of a bullish reversal.
-
Major Resistance: The 52-week high of $22.74 is the key ceiling for the stock. A breakout above this level on high volume would signal a continuation of the long-term uptrend and new price discovery.
Conclusion for Traders
SoFi (SOFI) is currently at a critical juncture. While it has been a top performer over the last year, it’s now facing immediate selling pressure near its 52-week high.
-
The Bearish Case: The stock is trading at a high valuation (P/E ~50), is highly volatile (Beta ~1.92), and most importantly, has a consensus analyst price target ($16.95) that suggests significant overvaluation. The sharp drop at the market open could be the start of a needed correction.
-
The Bullish Case: The long-term trend has been strongly positive. If the market shrugs off this morning’s dip and reclaims the $21.51 level, it could be seen as a minor pullback in a strong uptrend, potentially setting up another test of the 52-week high.
Traders should closely monitor volume alongside price. An increase in selling volume on a break of the day’s low would strengthen the bearish case, while a volume-supported move back above resistance would favor the bulls.
Disclaimer: This article is for informational and educational purposes only and does not constitute financial advice or a recommendation to buy or sell any security. The author is not a licensed financial advisor. All trading and investment decisions should be made based on your own research, due diligence, and consultation with a qualified financial professional. Stock market trading involves significant risk, and you could lose some or all of your investment.