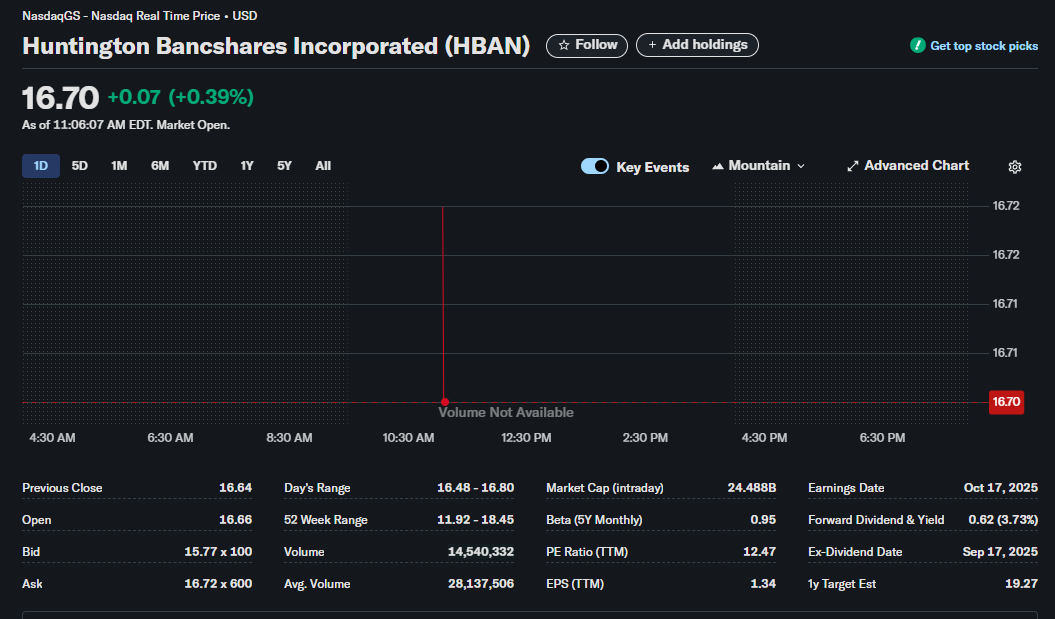
Huntington Bancshares Incorporated (NASDAQ: HBAN), a major regional bank holding company, is on the radar of many investors. As of the latest data point, the stock is trading at 0.07 (+0.39%) during the trading session. For traders and investors looking to understand the current position and future potential of HBAN, a deep dive into its key financial metrics is essential.
This article breaks down the critical data points provided in the stock report to offer a clear, actionable analysis for your trading strategy.
Disclaimer: This article is for informational and educational purposes only. It is not financial advice. The information presented is based on the data provided in the image and general market knowledge. Stock trading involves significant risk, and you should always conduct your own thorough research and consult with a qualified financial advisor before making any investment decisions.
Current Price Action and Intraday Snapshot
Understanding a stock’s intraday behavior provides clues about current market sentiment and liquidity.
-
Current Price: $16.70
-
Open vs. Previous Close: The stock opened at 16.64. This indicates a small positive sentiment gap at the market open.
-
Day’s Range: The stock has fluctuated between $16.48 and $16.80 so far. This range gives traders an idea of the day’s volatility. The current price of $16.70 is situated in the upper portion of this range, suggesting some intraday strength.
-
Volume Analysis: The current volume is 14,540,332 shares. Comparing this to the average volume of 28,137,506, we can see that by mid-morning (11:06 AM EDT), the stock has already traded about half of its typical daily volume. This indicates a heightened level of interest and activity in HBAN today.
-
Bid/Ask Spread:
-
Bid: $15.77 x 100
-
Ask: $16.72 x 600
-
The Bid is the highest price a buyer is willing to pay, while the Ask is the lowest price a seller is willing to accept. The numbers ‘x 100’ and ‘x 600’ represent the number of shares being bid on or offered at those prices (in lots of 100). The current spread is unusually wide, which could be indicative of a momentary data glitch or volatility. Typically, a tighter spread suggests higher liquidity.
-
Historical Context and Volatility Profile
Looking beyond the day’s trading helps to frame the current price within a broader context.
-
52-Week Range: $11.92 – $18.45
This is a crucial metric. The current price of $16.70 is comfortably in the upper half of its 52-week range. This suggests the stock has strong momentum over the past year and is trading closer to its peak than its trough. For momentum traders, this could be a bullish sign, while value investors might be more cautious, looking for potential pullbacks. -
Beta (5Y Monthly): 0.95
Beta measures a stock’s volatility relative to the overall market (typically the S&P 500, which has a beta of 1.0). A beta of 0.95 indicates that HBAN is slightly less volatile than the market. This suggests a more stable investment, less prone to wild swings compared to the broader market index, which is a characteristic often sought in banking stocks.
Valuation and Fundamental Health
Are you paying a fair price for the company’s earnings and size? These metrics provide insight.
-
Market Cap (Intraday): $24.488 Billion
With a market capitalization of over $24 billion, Huntington Bancshares is a large-cap stock. This generally implies a stable, well-established company with significant institutional ownership, which can lend to its stability. -
P/E Ratio (TTM): 12.47
The Price-to-Earnings ratio is a classic valuation metric. A P/E of 12.47 means investors are willing to pay $12.47 for every $1 of the company’s past year’s earnings. For the banking sector, this is generally considered a reasonable and potentially attractive valuation, suggesting the stock is not over-extended. To confirm this, a trader should compare HBAN’s P/E ratio to its direct competitors in the regional banking space. -
EPS (TTM): 1.34 represents the portion of the company’s profit allocated to each outstanding share of common stock. It is the fundamental driver of the P/E ratio and confirms the company’s profitability on a per-share basis.
Future Outlook and Shareholder Returns
Where do analysts see the stock going, and how does the company reward its shareholders?
-
1y Target Est: 19.27. This consensus price target suggests a potential upside of approximately 15.4% from the current price of $16.70. This indicates a bullish outlook from the analyst community covering the stock.
-
Forward Dividend & Yield: 0.62 per share, which translates to a robust dividend yield of 3.73%. This is a significant return for income-focused investors and provides a steady income stream, which can cushion against price volatility.
-
Key Dates for Traders:
-
Ex-Dividend Date: Sep 17, 2025
-
Earnings Date: Oct 17, 2025
-
Note: The dates provided seem unusually far in the future. U.S. companies typically report earnings and pay dividends quarterly. It is highly recommended that traders verify the next upcoming earnings and ex-dividend dates from the company’s official investor relations website, as these events are major catalysts for stock price movement. The ex-dividend date is the cutoff day; you must own the stock before this date to be eligible for the upcoming dividend payment.
-
A Trader’s Summary: Key Takeaways for HBAN
-
Sentiment: The stock shows positive intraday momentum, trading in the upper end of its daily range with higher-than-average volume, signaling strong trader interest.
-
Valuation: HBAN appears reasonably valued with a P/E ratio of 12.47, which is typical for a stable bank. It is not in “bubble” territory.
-
Volatility: With a Beta of 0.95, the stock is slightly less volatile than the market, making it a potentially more stable holding in a diversified portfolio.
-
Growth & Income Potential: The stock presents a compelling dual-case scenario. The analyst target of $19.27 suggests significant capital appreciation potential, while the strong 3.73% dividend yield provides a solid income stream.
-
Actionable Strategy:
-
For Momentum Traders: The stock is trading near its 52-week high. Watch for a potential breakout above the $18.45 resistance level or look for consolidation patterns for entry points.
-
For Income Investors: The attractive dividend yield makes HBAN a strong candidate. The key is to buy before the next ex-dividend date (which should be verified for the correct quarter).
-
For Value Investors: While not at its 52-week low, the P/E ratio suggests the stock isn’t overpriced. A pullback towards the middle of its 52-week range could present a more attractive entry point.
-
Before executing any trade, always confirm critical data points and upcoming catalyst dates from reliable sources and align your strategy with your personal risk tolerance.