A deep dive into the key metrics for Warner Bros. Discovery (WBD) as the stock hovers near its 52-week high amidst signs of fundamental challenges. What should traders be watching?
Disclaimer: This article is for informational and educational purposes only. It is not financial advice. The information presented is based on a snapshot of market data at a specific time and may not be current. Trading and investing in stocks involve significant risk, and you should conduct your own thorough research and consult with a qualified financial advisor before making any investment decisions.
Overview: A Snapshot in Time for WBD
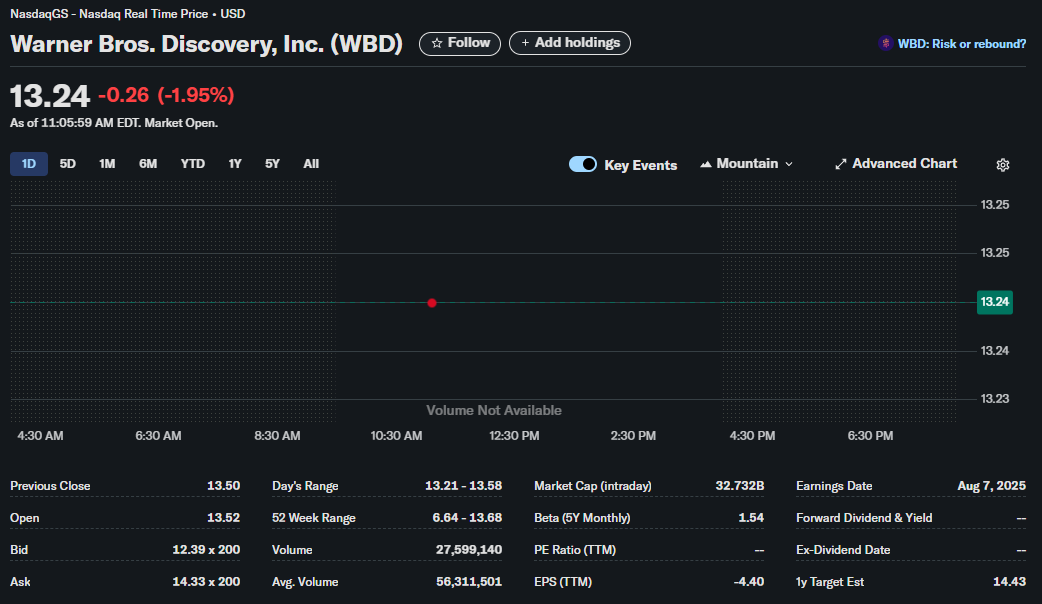
On the morning of this analysis, Warner Bros. Discovery, Inc. (ticker: WBD) is experiencing a modest downturn in a busy market. The stock, trading on the Nasdaq, reflects a narrative of both opportunity and risk that many traders are currently weighing, a sentiment echoed by the platform’s own “WBD: Risk or rebound?” tag.
Let’s break down the data from the trading screen to build a comprehensive picture for potential trading strategies.
Current Market Data (as of 11:05:59 AM EDT):
-
Ticker: WBD
-
Company: Warner Bros. Discovery, Inc.
-
Current Price: $13.24
-
Day’s Change: -$0.26 (-1.95%)
-
Market Cap (Intraday): $32.732 Billion
The stock is down nearly 2% for the session, indicating bearish sentiment in early trading. However, a single day’s performance rarely tells the whole story. To understand the context, we must dig deeper into the key metrics provided.
Section 1: Intraday Price Action and Volume Analysis
For a day trader, the immediate price action and volume are paramount.
-
Previous Close: $13.50
-
Open: $13.52
-
Day’s Range: $13.21 – $13.58
Analysis:
WBD opened slightly above its previous close, suggesting initial optimism. However, the price has since fallen to its current level of (13.21) is a key level of intraday support that traders will be watching closely. A break below this could signal further downside.
-
Volume: 27,599,140
-
Average Volume: 56,311,501
Expert Insight:
This is a critical piece of data. The current volume at midday is just under half of its daily average. Lower-than-average volume on a down day can be interpreted in two ways:
-
Lack of Conviction: The selling pressure may not be strong, and the downward move could be driven by a small number of sellers or general market weakness rather than a fundamental shift in sentiment against WBD.
-
A “Wait-and-See” Approach: Traders and institutions might be holding back, waiting for a clearer signal or catalyst before committing to large positions.
For traders, this suggests that while the price is down, the move isn’t backed by overwhelming selling pressure, which could make it susceptible to a quick reversal if buyers step in.
Section 2: The Bigger Picture – Volatility and Long-Term Range
Stepping back from the intraday noise, the 52-week data and Beta provide crucial context about risk and potential.
-
52 Week Range: $6.64 – $13.68
-
Beta (5Y Monthly): 1.54
Analysis:
The current price of $13.24 is positioned at the extreme high end of its 52-week range. The all-year high of $13.68 is now acting as a significant technical resistance level.
-
For Bulls: A decisive break and hold above $13.68 could signal a major breakout, potentially attracting momentum traders.
-
For Bears: The proximity to the 52-week high makes it an attractive point for short-sellers or for long-holders to take profits, as stocks often face rejection at these levels.
The Beta of 1.54 quantifies the stock’s volatility. It means that, on average, WBD is 54% more volatile than the S&P 500. For traders, this is a double-edged sword: it offers the potential for larger and faster gains but comes with a proportionally higher risk of larger losses.
Section 3: Fundamental Health Check
While traders often focus on technicals, fundamentals provide the “why” behind the price movements and are crucial for understanding a stock’s underlying value.
-
EPS (TTM – Trailing Twelve Months): -$4.40
-
PE Ratio (TTM): — (Not Applicable)
-
Forward Dividend & Yield: — (None)
Analysis:
This is the most concerning part of the report. A negative Earnings Per Share (EPS) of -$4.40 indicates that Warner Bros. Discovery is not currently profitable. Over the last year, the company has lost $4.40 for every outstanding share of common stock.
Because the earnings are negative, a traditional Price-to-Earnings (P/E) ratio cannot be calculated, hence the “–” entry. This lack of profitability is a major red flag for long-term value investors and a key reason why the stock may be perceived as a “risk.”
Furthermore, the company pays no dividend. This is common for companies that are either investing heavily in growth or, as is the case with WBD, are focused on paying down the significant debt load acquired during the WarnerMedia-Discovery merger.
Section 4: Future Outlook and Analyst Sentiment
Where do market professionals see the stock going?
-
1y Target Est: $14.43
-
Earnings Date: Aug 7, 2025
Analysis:
The average 1-year analyst price target of $14.43 suggests a modest upside of approximately 9% from the current price. While positive, it’s not an overwhelmingly bullish forecast and is only slightly above the current 52-week high. Traders might see this as a realistic target if the company demonstrates progress in its turnaround strategy.
The Earnings Date of August 7, 2025, is an unusual data point, as it’s very far in the future. This is likely a data error on the platform, and traders should verify the next quarterly earnings report date (likely in early August 2024). Earnings reports are major catalysts that can cause significant price swings and are critical dates to have on the calendar.
Conclusion: Key Takeaways for Traders
Synthesizing all this information, here is a summary for traders considering a position in WBD:
The Bullish Case (Reasons to Buy):
-
Momentum Potential: The stock is trading near its 52-week high. A breakout above $13.68 could trigger a new upward leg.
-
Analyst Upside: Analysts see a potential, albeit modest, rise to $14.43.
-
High Beta: For traders with a high-risk tolerance, the 1.54 Beta offers the potential for amplified returns on short-term moves.
The Bearish Case (Reasons to Sell/Short):
-
Strong Resistance: The 52-week high ($13.68) is a powerful technical barrier where the stock could be rejected.
-
Weak Fundamentals: The company is unprofitable (EPS of -$4.40), carries significant debt (not shown, but widely known), and pays no dividend.
-
Low Volume on Decline: While not overwhelmingly bearish, the lack of strong buying interest to defend the price level is a concern.
Final Verdict for Traders:
Warner Bros. Discovery (WBD) is a classic “story stock” at a technical inflection point. Traders should be cautious. The conflict between the bullish technical setup (proximity to a breakout) and the bearish fundamental reality (unprofitability) makes it a high-risk, high-reward play.
-
Short-term traders should watch the 13.68 (52-week high) levels with discipline.
-
Swing traders might wait for a confirmed breakout above the 52-week high on high volume or a breakdown below key support levels before entering a position.
-
All traders must be aware of the underlying fundamental weakness, as any negative news related to debt, subscriber numbers, or profitability could quickly undermine the stock’s technical strength.