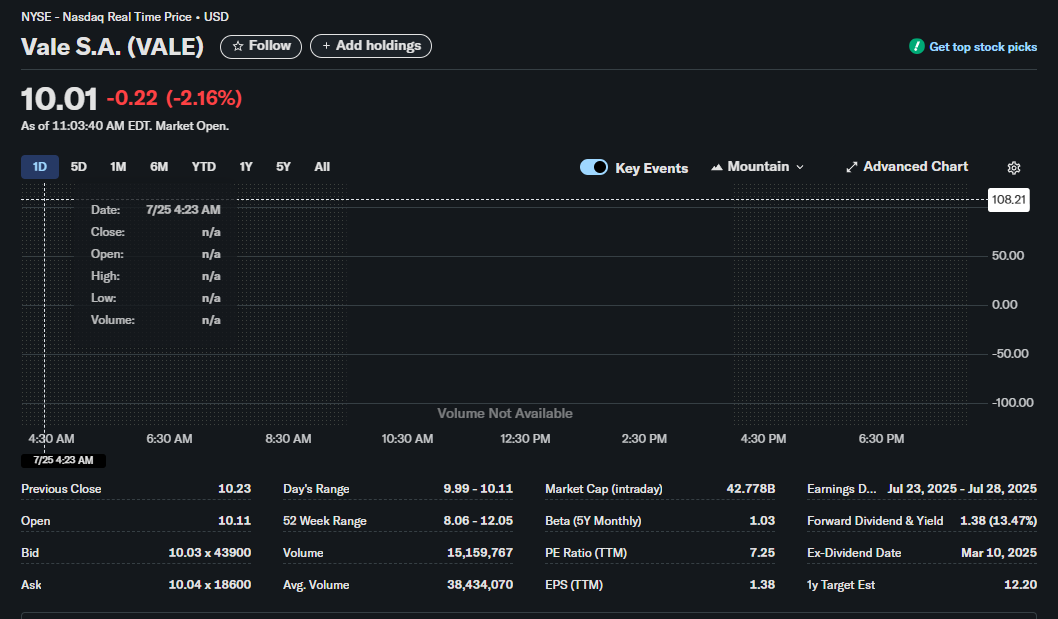
Vale S.A. (NYSE: VALE), a global mining giant, is currently experiencing notable trading activity. This report provides a comprehensive analysis of its stock performance and key financial metrics as of 11:03:40 AM EDT. For traders and investors, understanding these data points is crucial for making informed decisions.
As of the latest report, VALE is trading at 0.22 (2.16%) for the day. This downward movement invites a closer look at the underlying data to understand the sentiment and potential opportunities surrounding the stock.
Disclaimer
This article is for informational and educational purposes only and should not be construed as financial or investment advice. The data presented is based on a single point in time and is subject to change. All trading and investment decisions carry risk. Always conduct your own thorough research (DYOR) and consult with a qualified financial advisor before making any investment decisions.
I. Current Daily Trading Snapshot
Understanding the intraday performance provides a window into the market’s immediate sentiment towards a stock.
-
Previous Close: $10.23
-
Open: $10.11
-
Day’s Range: $9.99 – $10.11
Analysis for Traders:
The stock opened lower than its previous close, an action known as a “gap down.” This often signals bearish sentiment from the outset of the trading session. The day’s high was the opening price ($10.11), and it has since trended downwards to a low of $9.99. Trading at $10.01, VALE is currently hovering near the bottom of its daily range, indicating sustained selling pressure throughout the morning.
II. Liquidity and Volume Analysis
Liquidity and volume are critical indicators of trader interest and the ease of executing trades.
-
Bid: $10.03 x 43900
-
Ask: $10.04 x 18600
-
Volume: 15,159,767
-
Avg. Volume (3-month): 38,434,070
Analysis for Traders:
-
Bid-Ask Spread: The spread between the bid and ask price is very tight at just one cent ($0.01). This indicates high liquidity, meaning traders can buy or sell the stock with minimal price slippage. The substantial size on both the bid (43,900 shares) and ask (18,600 shares) further confirms a liquid market.
-
Volume vs. Average Volume: The current volume of ~15.2 million shares is significantly below its three-month average of ~38.4 million. With the market already open for a couple of hours, this lower-than-average volume could suggest a lack of strong conviction from either buyers or sellers, or that traders are waiting for a specific catalyst before making large moves.
III. Valuation and Performance Context
Looking at valuation metrics and historical ranges helps place the current price in a broader context.
-
Market Cap (Intraday): $42.778 Billion
-
52-Week Range: $8.06 – $12.05
-
Beta (5Y Monthly): 1.03
-
P/E Ratio (TTM): 7.25
-
EPS (TTM): $1.38
Analysis for Traders:
-
Position in 52-Week Range: At 8.06) than its high ($12.05). This could be interpreted in two ways: some may see it as a potential buying opportunity if they believe the company is undervalued, while others might view it as a sign of persistent weakness.
-
Valuation (P/E Ratio): A Price-to-Earnings (P/E) ratio of 7.25 is generally considered low, especially when compared to the broader market average (often 20-25). This low P/E could suggest that the stock is undervalued relative to its earnings. However, it’s essential to compare this to other companies in the mining and materials sector, as they often have lower P/E ratios.
-
Volatility (Beta): A beta of 1.03 indicates that VALE’s stock price is expected to move almost in line with the overall market, but with slightly higher volatility. A 3% market rise might result in a ~3.09% rise for VALE, and vice versa.
IV. Dividends and Future Outlook
Forward-looking indicators provide insight into potential future returns and key dates for investors to watch.
-
Forward Dividend & Yield: $1.38 (13.47%)
-
Ex-Dividend Date: March 10, 2025
-
1y Target Estimate: $12.20
-
Earnings Date: July 23, 2025 – July 28, 2025
Analysis for Traders:
-
Exceptional Dividend Yield: A forward dividend yield of 13.47% is exceptionally high and is a major point of interest. This makes VALE a potentially attractive stock for income-focused investors. The high yield could provide a cushion against price declines and generate significant cash flow for shareholders.
-
Ex-Dividend Date: To be eligible for the next announced dividend, an investor must own the stock before the ex-dividend date of March 10, 2025. This date is a key catalyst that often influences buying activity.
-
Analyst Target: The 1-year analyst target estimate of $12.20 suggests a potential upside of over 21% from the current price of $10.01. This indicates that, on average, market analysts believe the stock has room to grow over the next year.
-
Earnings Date: The next earnings report is projected for late July 2025. Traders should mark this on their calendars, as earnings announcements are major catalysts for price volatility.
Key Takeaways and Conclusion
Based on this snapshot, here are the crucial takeaways for anyone considering a trade or investment in Vale S.A. (VALE):
-
Bearish Short-Term Momentum: The stock gapped down at the open and is trading near its daily low on below-average volume, signaling caution in the immediate term.
-
Attractive Value & Income Play: The combination of a very low P/E ratio (7.25) and an extremely high dividend yield (13.47%) presents a strong case for value and income investors who are willing to look past the current price weakness.
-
Potential for Upside: Analyst consensus points to a target price of $12.20, suggesting significant potential for capital appreciation over the next year.
-
Key Levels to Watch: The 52-week low of $8.06 serves as a critical support level, while the day’s high of $10.11 and the previous close of $10.23 are immediate resistance levels to overcome.
In summary, Vale S.A. appears to be a tale of two stories: short-term bearish price action contrasted with strong long-term value and income fundamentals. Traders must weigh the current negative sentiment against the compelling valuation metrics and high dividend yield.