
Beyond the Ticker: Unpacking the Story Behind a Single Snapshot of a Tech Giant
In the vast, churning ocean of the stock market, we are often drawn to the big picture—the sweeping year-long trends, the dramatic quarterly earnings reports, the seismic shifts that define industries. But sometimes, the most compelling stories are found not in the epic saga, but in a single, fleeting chapter. The image before us is exactly that: a snapshot, a digital fossil capturing 24 hours in the life of one of the world’s most pivotal technology companies, NVIDIA Corporation.
At first glance, it’s just a collection of numbers and a jagged line on a dark background. But to look closer is to see a drama unfold. It’s a story of ambition, hesitation, conflict, and uncertainty, all played out in fractions of a dollar. This isn’t just data; it’s the digital footprint of human psychology—of millions of decisions, hopes, and fears culminating in a single day’s trading.
Let’s peel back the layers of this image, not to predict the future, but to understand the present and appreciate the complex dance of forces that shape a company’s value, one second at a time.
 1. The Opening Bell: First Impressions and Key Figures
Before we even look at the graph, the header provides the day’s summary, the final verdict written in bold characters.
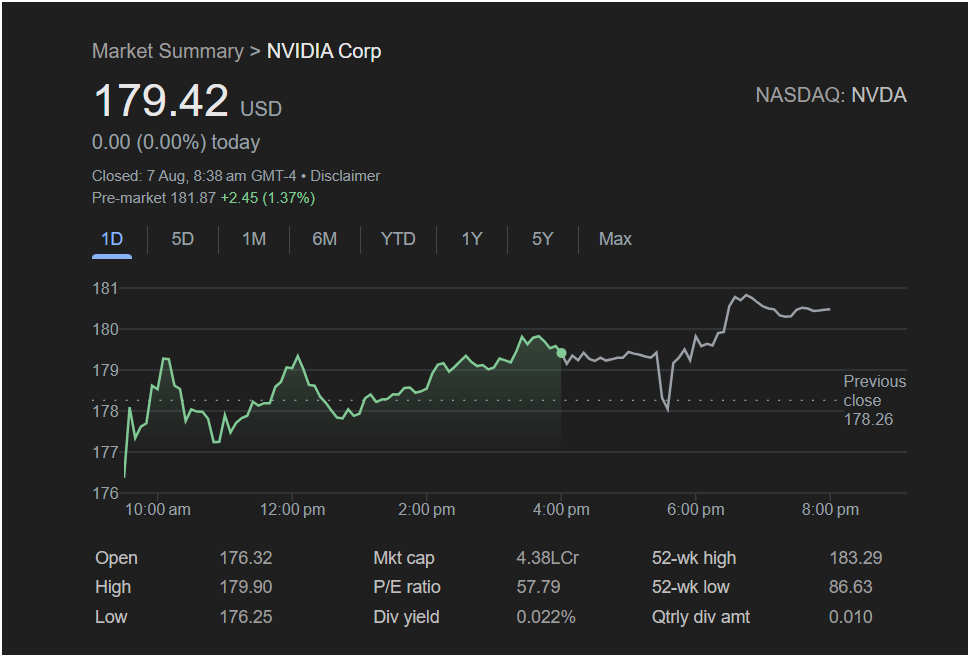
179.42 USD. This is our protagonist’s closing price. It’s the number that will be etched into the historical record for this day. But a price in isolation is meaningless. It’s the context that gives it weight.
0.00 (0.00%) today. This is, perhaps, the most intriguing detail of all. After a full day of trading—a day we will soon see was anything but calm—the stock ended exactly where it started. Imagine a furious tug-of-war between two equally matched teams, pulling with all their might for hours, only for the rope’s center flag to end up precisely on the starting line. This “flat” close masks a day of significant volatility. It suggests a market in perfect, if temporary, equilibrium. The bulls who believe in NVIDIA’s future growth and the bears who believe it’s overvalued fought to an absolute standstill. This is not apathy; this is a hard-won stalemate.
Closed: 7 Aug, 8:38 am GMT-4 • Disclaimer. The timestamp tells us this is likely data compiled shortly after the US markets have opened for pre-market trading on the following day (8:38 am EDT). The date is August 7th of an unspecified year. Given the price level, this snapshot is likely from several years ago, a moment in NVIDIA’s journey to becoming the trillion-dollar behemoth it is today.
Pre-market 181.87 +2.45 (1.37%). Here is our first plot twist. While the previous day ended in a draw, the battle is already raging again before the next official opening bell. The stock is up significantly in pre-market trading. This suggests that some news, an analyst upgrade, or a broader market sentiment shift occurred overnight or in the early morning. This pre-market surge acts as a cliffhanger, leaving us to wonder if the bulls have finally found the strength to break the previous day’s deadlock.
2. The Heart of the Day: Charting the Intraday Tug-of-War
Now, we turn our attention to the centerpiece: the line graph. This chart is the day’s electrocardiogram, showing the heartbeat of the stock. We can break the narrative down into three distinct acts.
Act I: The Morning Mayhem (Approx. 10:00 am – 12:00 pm)
The day begins not with a bang, but with a plunge. The line starts below the dotted “Previous close” line of 178.26, indicating a lower open. We see an immediate, sharp dip, likely hitting the day’s low right out of the gate. This is common; a flood of overnight orders are executed at the opening bell, often causing a surge of volatility.
What followed was a fierce battle. The stock didn’t languish at its lows. Instead, it staged a powerful recovery, soaring past the previous close line to form the first major peak of the day around 10:30 am, touching nearly 180 USD. This V-shaped recovery is a classic sign of “dip-buying”—investors seeing the initial weakness as a bargain and rushing in to buy shares.
However, the victory was short-lived. The stock was quickly beaten back down, spending the next hour and a half oscillating wildly around that crucial 178.26 level. The jagged, sawtooth pattern in this period paints a picture of intense indecision. Every push by the buyers was met with an equal and opposite push by the sellers.
Act II: The Midday Lull (Approx. 12:00 pm – 3:00 pm)
As the market headed into the lunch hour, the chaos subsided. The volatility decreased, and the chart’s jagged teeth smoothed into a more determined, upward grind. This period represents a slow, steady accumulation of buying pressure. The bulls weren’t launching dramatic assaults anymore; they were patiently building their position, pushing the price floor higher and higher. This slow climb from ~178 USD to over 179.50 USD is often where institutional investors, with their large, methodical orders, make their presence felt, absorbing supply from sellers without causing sharp spikes.
Act III: The Afternoon Push and Peak (Approx. 3:00 pm – 4:00 pm)
As the end of the official trading day approached, the momentum built during the midday lull culminated in a final, decisive push. The stock surged to its highest point of the day, coming tantalizingly close to the 180 USD mark once more. This is often driven by traders trying to establish a final position before the close or by algorithms programmed to trade on end-of-day momentum. Reaching the day’s high in the final hour is often a bullish sign, suggesting strength into the close.
3. The After-Hours Enigma
The story doesn’t end when the closing bell rings at 4:00 pm. The chart continues into the after-hours session, and it’s here that things get particularly strange. Immediately after the official close, the price seems to hold steady before experiencing a sharp, dramatic plunge somewhere around 5:30 pm. It then stages an equally dramatic recovery, rocketing up to over 181 USD before settling down.
What could cause such a violent swing in the less-liquid after-hours market? It could be a number of things: a late-breaking news story, a company filing, or even a single large trade order being executed in a market with far fewer participants. This after-hours section serves as a powerful reminder that the market never truly sleeps and that a stock’s story is constantly being written, even when the main stage is dark.
4. The Fundamental Footing: What the Numbers Below the Chart Reveal
If the chart is the story, the data points below are the character statistics. They provide the fundamental context for the day’s action.
-
Open: 176.32, High: 179.90, Low: 176.25: These three numbers perfectly frame the day’s battleground. The range between the low and high was nearly $3.65, a significant intraday swing. Notice how the low (176.25) and the open (176.32) are nearly identical; this confirms our observation that the stock sold off immediately at the start of trading. The high being just shy of 180 shows that this level acted as a psychological resistance point all day.
-
Mkt cap: 4.38LCr: This figure is fascinating, primarily because of its notation. “LCr” stands for Lakh Crore, a unit used in the Indian numbering system (1 Lakh Crore = 1 Trillion). This tells us the screenshot was likely taken from a financial portal localized for an Indian audience. However, the value itself (4.38 Trillion INR) seems inconsistent with NVIDIA’s known market capitalization in US Dollars for the period when its stock was at this price level. This could be a data error or a quirk of the specific platform’s calculation. Regardless of the exact number, it signifies that NVIDIA was already a massive company, a leader in its field whose stock movements had the power to influence entire market indices.
-
P/E ratio: 57.79: The Price-to-Earnings ratio is a classic valuation metric. A P/E of 57.79 is considered high for the general market, but for a high-growth technology company like NVIDIA, it’s not unusual. This number tells us that investors were willing to pay $57.79 for every $1 of the company’s annual earnings. This high multiple is a bet on the future. It signals that the market expected NVIDIA’s earnings to grow at a phenomenal rate, justifying the premium price.
-
Div yield: 0.022% & Qtrly div amt: 0.010: This is the other side of the growth coin. A dividend yield of a mere 0.022% is minuscule. This shows that NVIDIA was not a company for income-seeking investors. Instead, it was reinvesting almost all of its profits back into the business—into research and development, into creating the next generation of GPUs, into funding the very innovation that investors were betting on with that high P/E ratio.
-
52-wk high: 183.29 & 52-wk low: 86.63: This provides the ultimate context. The day’s trading range, while volatile, occurred at the very top end of its 52-week performance. The high of the day (179.90) was just a stone’s throw from its yearly peak. This indicates the stock was in a powerful, sustained uptrend. The journey from 86.63 to this level represents a more than 100% gain over the past year, confirming the immense bullish sentiment surrounding the company.
5. The Ghost in the Machine: What the Chart Doesn’t Tell Us
For all the information it contains, the chart is silent on the most important question: Why?
-
What news was driving the market that day? Was there a positive report on the semiconductor industry? Did a major competitor like AMD or Intel show signs of weakness?
-
What was the broader market doing? Was the NASDAQ index up or down? A rising tide lifts all boats, and a strong market can carry even a conflicted stock higher.
-
Were there any analyst upgrades or downgrades? A single influential analyst’s opinion can send ripples through a stock’s price.
-
What were the whispers on trading floors and online forums? The “story” behind a stock—its perceived role in AI, gaming, or the metaverse—is often as powerful as its financial statements.
This single-day chart is a symptom, not the cause. It is the result of countless external forces and human emotions that are invisible on the graph itself but are nonetheless the true drivers of its every peak and valley.
6. Lingering Questions: The Unwritten Next Chapter
We are left where we began, with a snapshot frozen in time. The day ended in a stalemate at 179.42, but the pre-market activity shows the story is far from over, with the stock gapping up towards 182.
This leaves us with a series of open-ended questions.
Was the flat close a moment of consolidation before the next major leg up, a pause to gather strength before smashing through the 52-week high? Or was it a sign of exhaustion, a final failure to breach the 180 resistance level, signaling an impending pullback?
How would the tension between the company’s high-flying valuation (P/E of 57.79) and its undeniable technological dominance resolve itself in the days and weeks to come?
This single image serves as a potent reminder that every stock chart is a living document. The next day’s candle was yet to be drawn, the next chapter unwritten. And for every investor holding a position, the question was not what the chart had done, but what it would do next. The answer, as always, lay in the future.


