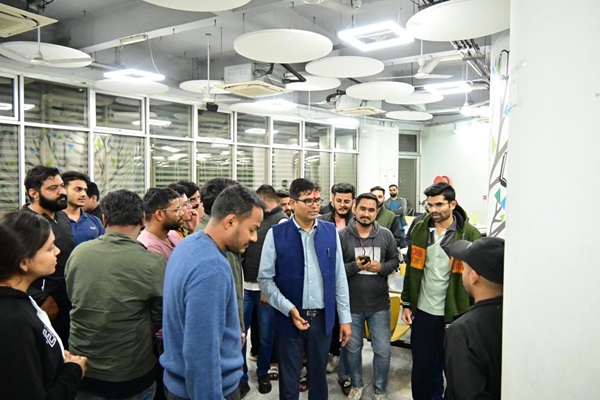
News

Intuit Stock Ignites at Open: Analysis Shows Strong Bullish Momentum

Intuit Inc. (NASDAQ: INTU) stock has launched into the trading day with significant force, showing strong buying pressure right from the opening bell. The early session gains and bullish price action are putting the software giant on a clear path to challenge its 52-week high, presenting a compelling scenario for traders.

This analysis is based on live market data from Wednesday, July 3rd, at 9:45 AM GMT-4, just 15 minutes into the trading session.

A Powerful Start to the Day

The screenshot captures Intuit stock trading at

6.28 (0.81%) in the first few minutes of trading. The price action reveals a highly bullish sentiment.


  • Previous Close: $773.70

  • Open: $777.57

  • Low of the Day: $776.69

  • High of the Day: $780.76

The intraday chart shows a classic “buy the dip” pattern at the open. The stock opened higher, experienced a very brief and shallow dip to its low, and was immediately met with aggressive buying that propelled it to a new session high. This V-shaped recovery at the open is a powerful technical signal that buyers are in firm control.

Key Metrics and Levels to Watch

With the stock on the move, these numbers are critical for any trader:

  • 52-Week High: $790.60. This is the most important price level on the chart. At its current price, Intuit is less than 2% away from this peak, making it the primary target for bulls today.

  • 52-Week Low: $532.64. This highlights the stock’s strong performance over the past year.

  • P/E Ratio: 63.47. This high valuation indicates that investors have priced in significant future growth, which is typical for a market leader in the software-as-a-service (SaaS) space.

  • Market Cap: Approximately $218 billion (based on “21.76KCr” figure), placing it among the tech sector’s heavyweights.

Outlook: Will Intuit Stock Continue to Rise Today?

The early signs are overwhelmingly bullish.

The Bullish Case (High Probability): The strong opening rally, combined with the immediate recovery from a minor dip, suggests a high probability of continued upward movement throughout the day. Buyers are showing conviction, and the path of least resistance is toward the 52-week high of $790.60. A break above this level could attract even more buying interest.

The Bearish Case (Low Probability): The only short-term risk is that this initial surge is a “morning spike” that could fade. If the stock were to reverse and break below the intraday low of $776.69, it would negate the bullish opening and signal that sellers are stepping in. However, the current price action makes this scenario less likely.

Conclusion for Traders: Is It Right to Invest Today?

The live trading action presents a strong case for a bullish day trade or short-term position.

  1. Key Target (Resistance): $790.60. This is the level to watch for a potential breakout.

  2. Key Support: The intraday low of $776.69 is the critical level for the bulls to defend. As long as the stock remains above it, the immediate trend is up.

  3. Trading Strategy: The setup is favorable for bullish trades. An entry on the current momentum, or on a small pullback that holds above the low, could be a viable strategy. The primary goal would be to ride the momentum toward the 52-week high.

Based on this powerful opening, Intuit stock is demonstrating significant strength, and the odds favor a continuation of this rally throughout the trading session.

Disclaimer: This article is for informational purposes only and is not financial advice. All investment and trading decisions should be made based on your own research and risk assessment in consultation with a certified financial professional.

Back to top button
close