
Netflix (NFLX) stock concluded a turbulent trading session with a marginal gain, but positive pre-market activity is signaling potential for a stronger start to the new week. After a day characterized by sharp swings, traders are closely watching to see if buyers can take decisive control. This analysis breaks down the essential data from the chart to prepare you for Monday’s market open.
Last Session’s Performance: A Day of Volatility and Indecision
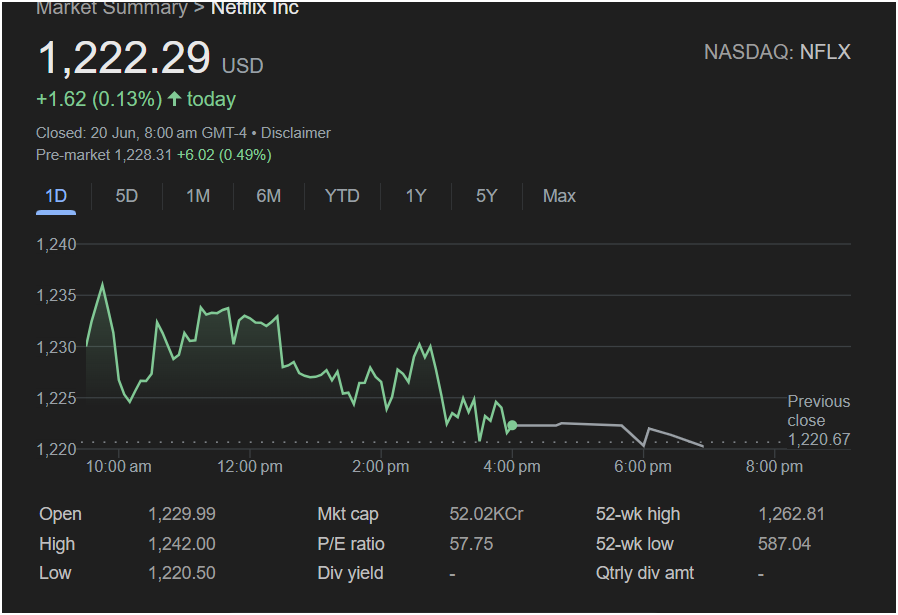
On Thursday, June 20th, Netflix stock was a battleground for bulls and bears, ultimately ending in a near stalemate. Here is a summary of the session’s key numbers:
-
Closing Price: $1,222.29
-
Daily Change: Up +$1.62 (+0.13%)
-
Day’s High: $1,242.00
-
Day’s Low: $1,220.50
The intraday chart shows a rollercoaster ride for investors. The stock opened at $1,229.99 and quickly spiked to its high of $1,242.00 in the first hour of trading. However, sellers stepped in aggressively, pushing the stock down to its low of $1,220.50. The remainder of the day saw the stock chop sideways before closing just slightly above the previous close of $1,220.67. This pattern suggests significant indecision in the market, with neither buyers nor sellers establishing clear dominance.
Pre-Market Signals Point to Upward Momentum
The outlook for Monday’s open appears more optimistic. The latest data shows Netflix stock in the pre-market at
6.02 (+0.49%). This pre-market strength indicates that buying interest is building before the opening bell.
What this means for traders on Monday:
-
Bullish Case: The positive pre-market action suggests Netflix will open higher. The most critical level to watch will be the previous session’s high of $1,242.00. A sustained break above this price could invalidate the recent selling pressure and signal a new upward trend, attracting more buyers.
-
Bearish Case: If the stock opens higher but fails to break the
1,222.29 and the day’s low of $1,220.50.
Essential Data for Traders and Investors
Understanding the broader context is vital for making informed trading decisions:
-
Market Cap: 52.02KCr. This places Netflix firmly in the mega-cap category, representing a leader in its industry.
-
P/E Ratio: 57.75. This is a relatively high price-to-earnings ratio, indicating that investors have strong expectations for Netflix’s future earnings growth.
-
52-Week Range: $587.04 –
1,262.81 serves as the next major long-term resistance target.
-
Dividend Yield: None. Netflix focuses on reinvesting capital for growth rather than issuing dividends.
Is It Right to Invest Today?
For Short-Term Traders:
The pre-market strength is a positive signal, but the volatility from the previous session calls for a cautious approach. The key to a successful trade on Monday will be watching the $1,242.00 level. A decisive move above this could be an entry point for a long position. Conversely, a failure to break through could offer a short-term selling opportunity.
For Long-Term Investors:
One day of choppy trading does not impact a long-term investment thesis. The fact that the stock is trading near its 52-week high is a testament to its strong performance. Long-term investors should base their decisions on Netflix’s fundamentals—such as subscriber growth, the success of its ad-supported tier, and its content strategy—rather than short-term price movements.
In conclusion, Netflix stock is showing bullish signs heading into Monday, but it faces a critical test at the $1,242 resistance level. A breakout could set the stage for further gains, while a failure could lead to another day of range-bound trading.


