
Palantir Technologies Inc. closed the trading week on a high note, posting a solid gain and leaving investors and traders to ponder its next move as the new week begins. The data-analytics firm’s stock performance on Friday showed significant volatility but ultimately resolved in the bulls’ favor, setting the stage for a potentially pivotal Monday session.
This article breaks down the key data from the latest trading session to provide a comprehensive outlook for traders.
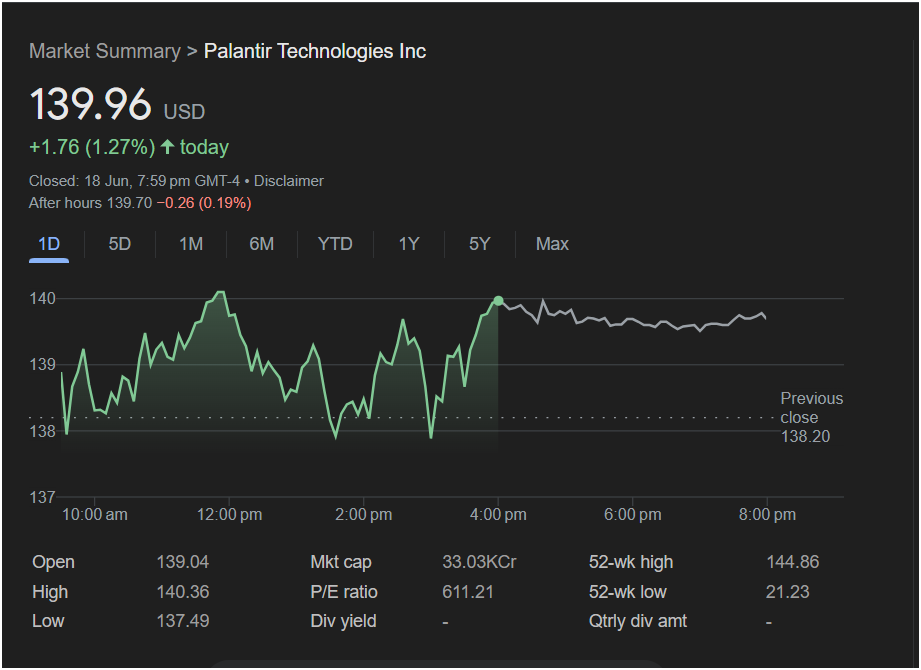 Friday’s Market Recap
Palantir’s stock finished the day at 139.96 USD, marking a healthy increase of +1.76 (+1.27%). The session was a dynamic one for the stock, as shown by its daily range:
-
Open: 139.04
-
Day’s High: 140.36
-
Day’s Low: 137.49
-
Previous Close: 138.20
The stock opened higher than its previous close, dipped to find support around the 137.50 level, and then mounted a strong rally in the afternoon, peaking just before the market closed. This strong finish near the day’s high is often interpreted by traders as a bullish signal, suggesting positive momentum carrying into the next session.
However, a slight note of caution comes from the after-hours session, where the stock dipped slightly to 139.70, a minor loss of 0.19%. This could indicate some light profit-taking after the strong daily run-up.
Key Metrics Every Trader Should Watch
To understand the bigger picture, it’s essential to look beyond the daily price action. Here are the critical numbers from the market summary:
-
P/E Ratio: 611.21
This is an exceptionally high Price-to-Earnings ratio, indicating that the stock is priced for significant future growth. Investors are willing to pay a premium, but it also suggests the stock could be vulnerable to sharp pullbacks if it fails to meet these high expectations. -
52-Week Range: 21.23 – 144.86
At its current price of 139.96, Palantir is trading very near its 52-week high. This is a critical technical level. A decisive break above the 144.86 resistance could signal another leg up. Conversely, failing to break this level could see the stock retreat as sellers take control. -
Market Cap: 33.03KCr
This figure represents the total market value of the company. -
Dividend Yield: –
Palantir does not currently pay a dividend. This means investors are focused solely on capital appreciation (the stock price going up) for their returns.
Outlook for Monday: Bull vs. Bear Case
Based on the available data, traders are facing a classic scenario with strong arguments on both sides.
The Bullish Case (Why the Stock Might Go Up):
-
Strong Momentum: The stock closed with a significant gain and near the high of the day.
-
Testing Resistance: Approaching the 52-week high suggests powerful upward momentum that could lead to a breakout.
-
Buyer Support: The stock successfully bounced off its intraday low, showing that buyers stepped in to prevent a further slide.
The Bearish Case (Why the Stock Might Go Down):
-
Overvaluation Concerns: The sky-high P/E ratio makes the stock fundamentally expensive and susceptible to a correction.
-
Resistance at 52-Week High: The 144.86 level could act as a strong ceiling, where profit-takers and short-sellers may become active.
-
After-Hours Dip: The minor decline in after-hours trading, while small, hints that some selling pressure emerged right at the close.
: Is It Right to Invest?
For traders, Monday will be a crucial day of observation. Palantir’s stock is at a pivotal inflection point. A move with strong volume above the day’s high of 140.36 could signal a test of the 52-week high at 144.86. If it breaks that level, further upside is possible.
However, if the stock opens weak and falls below the previous day’s close of 139.96 and its support at the previous close of 138.20, it could indicate that the momentum has stalled and a pullback is more likely.
Given the high volatility and valuation, cautious traders may want to wait for a clear directional confirmation on Monday before committing to a new position.
Disclaimer: This article is for informational purposes only and is based on the analysis of past market data from the provided image. It does not constitute financial advice. All stock market investments carry a risk of loss. Please conduct your own research or consult with a qualified financial advisor before making any investment decisions.


