
NEW YORK, USA – Amazon.com Inc. (NASDAQ: AMZN) stock is signaling a potentially strong upward move for the next trading session, despite closing in the red on Monday, June 24. A significant surge in pre-market activity points to renewed investor confidence, presenting a critical moment for traders to watch. This article will break down Monday’s performance and provide a detailed analysis of what to expect.
Monday’s Trading Session: A Tale of Two Halves
Amazon stock finished Monday’s official trading session at
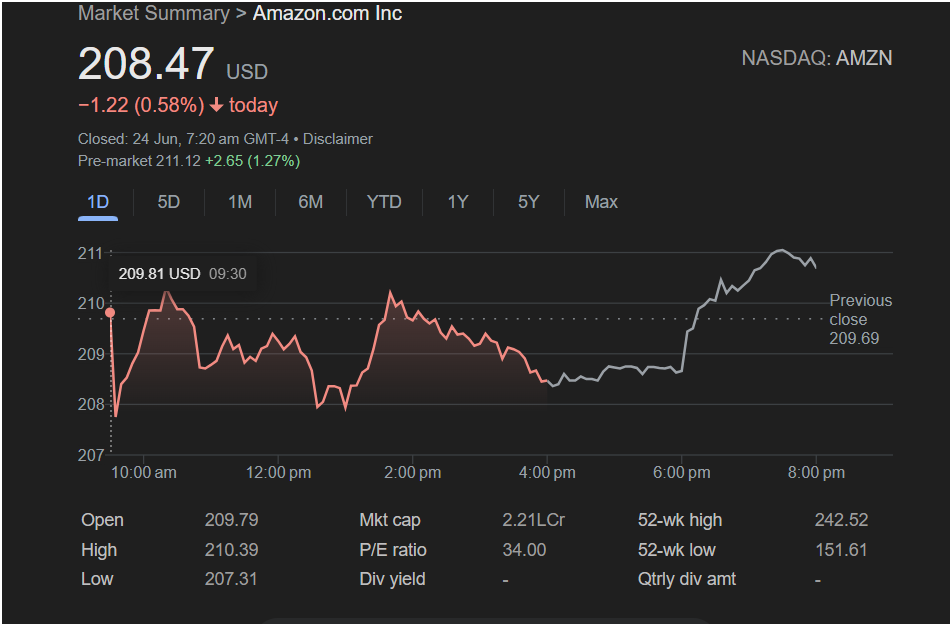
1.22 (0.58%). The day was characterized by bearish sentiment during regular market hours.
-
Open: The stock opened at $209.79, slightly above the previous close of $209.69.
-
Intraday Volatility: It quickly hit a high of
207.31.
-
The Close: The closing price near the lower end of the day’s range suggested that sellers were in control as the closing bell rang.
However, the story did not end there. A sharp rally in after-hours trading, visible on the chart after 4:00 PM, began to reverse the day’s losses.
The Pre-Market Surge: A Bullish Indicator for Tuesday
The most crucial piece of information for traders heading into the next session is the pre-market data. As of the latest update, Amazon stock is trading at
2.65 (1.27%) over Monday’s close.
This strong pre-market performance indicates a “gap up” opening is likely, where the stock will begin trading significantly higher than its previous close. This bullish momentum suggests that news, an analyst upgrade, or broad market optimism may be driving buying interest after hours.
Key Data & Technical Levels for Traders to Watch
To make an informed decision, traders should be aware of the following metrics and price levels:
Key Financial Metrics:
-
Market Cap: $2.21 Trillion (shown as 2.21L Cr)
-
P/E Ratio: 34.00, a valuation metric indicating the price per dollar of earnings.
-
Dividend Yield: None. Amazon does not currently pay a dividend, making it a pure growth stock.
-
52-Week Range: The stock is trading between a low of
242.52, placing it in the upper end of its yearly range.
Critical Price Levels:
-
Immediate Resistance: The pre-market price of $211.12 will be the first level to watch. A sustained move above this could signal further upside. The previous day’s high of $210.39 is a minor resistance level just below it.
-
Key Support: If the opening rally fades, the first line of support is Monday’s closing price of
207.31.
Is It Right to Invest in Amazon Stock Today?
Based on the data, the immediate momentum for Amazon stock is bullish. The strong pre-market rally has completely overshadowed the weak performance during Monday’s regular trading hours.
For traders, the key question will be whether this opening strength can be sustained.
-
A bullish scenario would see the stock open high and continue to climb, breaking past the $211.12 pre-market level with strong trading volume. This would confirm buyer control.
-
A bearish scenario could involve early profit-taking. Traders who bought during the after-hours rally might sell at the open, causing the initial price surge to fade. Watching if the price can hold above the $209.79 opening price from Monday would be a good indicator of strength.
In conclusion, while Monday’s close was weak, the powerful pre-market activity sets a very positive stage for the next session. Traders should approach with a clear strategy, watching the key resistance and support levels closely to confirm the direction of the trend after the opening bell.
Disclaimer: This article is for informational purposes only and is not intended as financial advice. Stock market trading involves risk, and you should consult with a qualified financial professional before making any investment decisions.


