Stock Market Today: Analysis of Progressive (PGR) KKR Medtronic (MDT) & CrowdStrike (CRWD) for Traders

This article presents an overview of four distinct stocks based on their historical data as provided in the screenshots. Traders should bear in mind that while this information aids analysis, real-time data and current market conditions are critical for any investment decision.
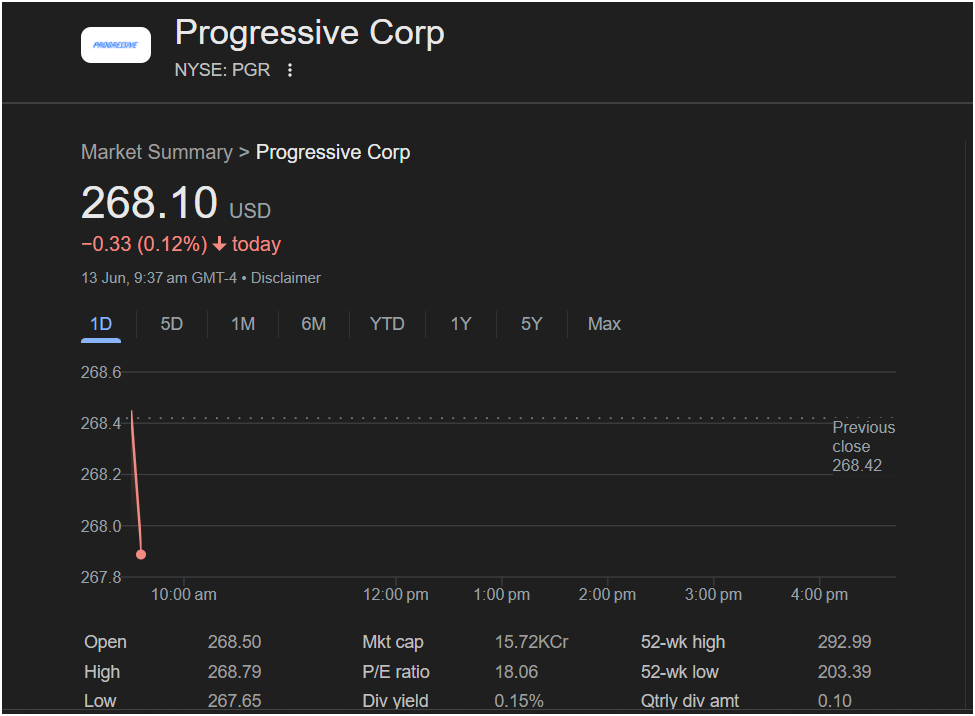
1. Progressive Corp (PGR) Stock Analysis
Key Information from the Snapshot (as of June 13th, 9:37 AM GMT-4):
- Current Price: $268.10 USD
- Today’s Change: -0.33 (-0.12%) today (Indicating a slight decline early in the trading day).
- Market Cap: 15.72 KCr (Very large-cap, suggesting a stable presence in the insurance sector).
- P/E Ratio: 18.06 (A moderate P/E, which might suggest a reasonably valued company in its industry).
- Dividend Yield: 0.15% (Relatively low, indicating it’s not primarily an income stock).
- Quarterly Dividend Amount: $0.10
- 52-week High: $292.99
- 52-week Low: $203.39
- Open (for the day): $268.50
- High (for the day): $268.79
- Low (for the day): $267.65
- Chart Pattern (1-Day): The chart shows a slight initial dip after market open from its previous close of $268.42, followed by very tight range trading around $268.
What a Trader Might Consider for PGR:
- Price Movement: PGR opened slightly down and showed very limited intraday volatility at the time of the screenshot. This could appeal to traders looking for low-volatility opportunities or suggest a lack of clear direction.
- Valuation: The P/E ratio of 18.06 is worth comparing to other insurance companies to determine if it’s over or undervalued.
- Dividend: The low dividend yield means the stock is unlikely to attract investors primarily seeking income.
- Industry Factors: Performance is tied to the insurance market, claims, interest rates (for investment income), and competition.
2. KKR & Co. Inc. (KKR) Stock Analysis
Key Information from the Chart (as of the last data point shown, likely June 13, 2025, or very close to it):
- Ticker Symbol: KKR (NYSE)
- Last Closing Price (C): $153.81 (This value seems to be for the last completed candle on the chart, indicating a strong positive day).
- Change Today (from previous close): +4.51 (+3.02%) (Reflects the change for the candle closing at $153.81).
- Open (O): $146.92, High (H): $154.40, Low (L): $146.92
- Volume (Vol): 6.67 M
- Bid/Ask (from top left): SELL: $122.50, BUY: $123.66 (These quotes are significantly lower than the chart’s last close, indicating a major data discrepancy or a very large gap down in pre-market for the next trading session).
- Pre-market Price (Pre): $123.50 (This confirms the significant drop implied by the Bid/Ask and suggests a major gap down from the $153.81 close).
- Previous Close (orange line): $125.24 (This horizontal line suggests a previous key level).
What a Trader Might Consider for KKR:
- Conflicting Data Alert: The stark difference between the last chart close ($153.81) and the pre-market/bid-ask quotes (around $123) is a critical red flag. This suggests either an outdated chart relative to the quotes, or a massive negative news event causing a significant pre-market gap down. A trader must confirm real-time pricing and search for news immediately.
- Recent Chart Action (assuming $153.81 was latest close): The chart shows KKR had been in a strong uptrend recently, with the last candle being very bullish, indicating strong buying interest on that day. However, if the pre-market is accurate, all those gains are potentially wiped out.
- Volume: The 6.67M volume for the bullish candle is significant, suggesting conviction behind that move, but this might be irrelevant if the stock gaps down dramatically.
- Support/Resistance: The $125.24 level (orange line) could be a crucial support/resistance flip zone. If the stock opens below it, this could become resistance.
3. Medtronic PLC (MDT) Stock Analysis
This section combines insights from a “Market Summary” and a “1D Chart.”
 Key Information from Market Summary (as of June 12th, 4:00 PM GMT-4):
- Current Price (Last Close): $88.49 USD
- Market Cap: 11.35 KCr (Large-cap medical device company).
- P/E Ratio: 24.48 (Higher P/E for a mature company, suggesting some growth expectations).
- Dividend Yield: 3.21% (Attractive for income-focused investors).
- Quarterly Dividend Amount: $0.71
- 52-week High: $96.25, 52-week Low: $75.96
Key Information from 1D Chart (Likely June 13th, as pre-market matches previous query for this date):
- Last Closing Price (C): $90.97 (This refers to a historical candle, not the visually last one).
- Open (O): $89.86, High (H): $91.11, Low (L): $89.70
- Volume (Vol): 5.2M
- Pre-market Price (Pre): $87.79 (A slight drop from the June 12th close of $88.49).
- Previous Close (orange line): $88.49 (Matches the Market Summary for June 12th).
What a Trader Might Consider for MDT:
- Price Performance: The stock is trading in the mid-range of its 52-week high/low. The pre-market indicates a slight dip from the previous day’s close.
- Income vs. Growth: MDT offers a solid dividend yield, appealing to income investors. Its P/E indicates moderate growth expectations.
- Recent Chart Action: The chart shows a recent recovery trend from earlier lows. The visually last candle appears to be an upward move, but the pre-market indicates a slight setback.
- Data Inconsistency: The numerical O/H/L/C at the top of the chart don’t match the visual position of the most recent candles or the detailed previous close. Traders should rely on live, accurate data.
- Industry Factors: Performance is tied to healthcare trends, medical device innovation, and regulatory landscape.
4. CrowdStrike Holdings Inc (CRWD) Stock Analysis
This section combines insights from a “Market Summary” and a “1D Chart.”
Key Information from Market Summary (as of June 13th, 8:46 AM GMT-4):
- Current Price (Last Close): $481.73 USD
- Today’s Change: 0.00 (0.00%) today (Reflects closing price).
- Pre-market Price: $477.53 (down $4.20 or 0.87%) – Suggests a potential opening lower.
- Market Cap: 12.01 KCr (Large-cap cybersecurity company).
- 52-week High: $491.20, 52-week Low: $200.81
Key Information from 1D Chart (Likely June 13th):
- Last Closing Price (C): $417.22 (This numerical value seems to be for an earlier candle on the chart, not the most recent one).
- Open (O): $408.00, High (H): $419.39, Low (L): $405.02
- Volume (Vol): 3.11 M
- Pre-market Price (Pre): $477.00 (Matches the market summary’s pre-market value).
- Previous Close (orange line): $481.73 (Matches the market summary’s close).
What a Trader Might Consider for CRWD:
- Price Performance: The stock is trading very close to its 52-week high, indicating strong recent momentum.
- Pre-market Dip: The pre-market decline of 0.87% from the previous close suggests a slight negative sentiment before the market opens, which needs to be investigated for underlying causes.
- Growth Stock: CRWD is a high-growth cybersecurity company, likely to be volatile and priced for significant future growth.
- Recent Chart Action: The 1D chart shows a strong uptrend after a prior correction, with the stock nearing its all-time highs.
- Data Inconsistency: Similar to MDT and KKR, the numerical O/H/L/C at the top of the chart do not match the visual position of the most recent candles, which are much higher. Traders must rely on real-time, accurate data.
Is it Right to Invest Today? (General Advice for Any Stock)
Based solely on these historical screenshots and the partial/inconsistent information they provide, it is impossible and irresponsible to provide an answer on whether it is “right to invest today” for any of these stocks. The KKR data, in particular, raises significant concerns due to the massive discrepancy between the chart’s last close and the pre-market quotes.
Critical factors for any trader to consider before making a decision:
- Real-time Data: The provided data is historical and, in some cases, inconsistent within the same screenshot. Always obtain the most current, real-time stock prices, pre-market/after-hours movements, and overall market context from a reliable trading platform.
- Breaking News: Immediately search for any breaking news, earnings reports, analyst upgrades/downgrades, or industry-specific developments for each company. This is crucial for understanding sudden price movements.
- Comprehensive Technical Analysis: Utilize a full charting platform to analyze trends, support/resistance levels, candlestick patterns, and various technical indicators (e.g., RSI, MACD, Bollinger Bands) across multiple timeframes.
- Thorough Fundamental Analysis: Dive deeper into each company’s financial statements, management, competitive landscape, and future growth prospects.
- Risk Management: Define your personal risk tolerance, set stop-loss levels, and determine appropriate position sizing for any trade.
- Investment Horizon: Clearly define your investment goals (e.g., day trading, swing trading, long-term investing) and exit strategy.
- Diversification: Never put all your investment capital into a single stock.
- Professional Advice: For personalized financial advice, always consult a qualified and licensed financial advisor.


