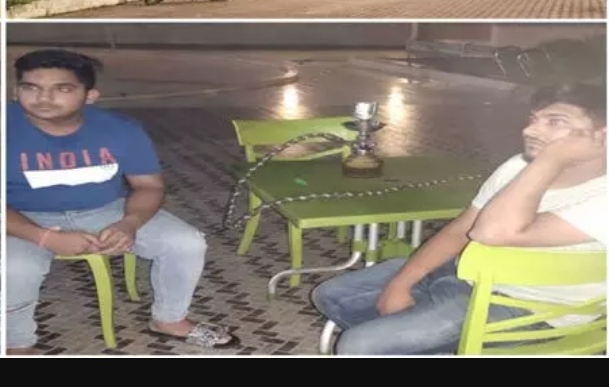
News

Amazon Stock Analysis: Pre-Market Activity Suggests Monday Rebound After a Tepid Close

Amazon.com Inc. (AMZN) stock is presenting a mixed but potentially optimistic picture for traders heading into the new week. After a day of volatile, sideways trading that ended in a slight loss, positive pre-market action suggests buyers may be stepping back in, setting the stage for a possible recovery on Monday.

For traders looking to position themselves, understanding Friday’s price action and the early indicators for Monday is crucial.

Friday’s Market Recap: A Tug-of-War

Amazon stock closed the session at

0.54 (0.24%). While the net change was small, the intraday chart reveals a battle between buyers and sellers:


  • The stock opened at $219.73, slightly below the previous close of $220.46.

  • An initial wave of buying pressure pushed the price to a daily high of $221.60 around noon.

  • However, the stock could not sustain these gains, selling off in the afternoon to a low of $219.06 before finding support and drifting sideways into the close.

This price action indicates that while there was buying interest, sellers took control in the latter half of the day, preventing a positive close.

The Outlook for Monday: A Cautiously Optimistic Signal

The most significant piece of data for predicting Monday’s open is the pre-market activity. The screenshot shows Amazon stock trading at

0.40 (0.18%) from its official close.


This upward tick in the pre-market session is a bullish signal. It indicates that demand for the stock is present after hours and could translate into a stronger opening on Monday. The price is attempting to reclaim the previous day’s closing price of $220.46, which will be a key level to watch.

What Traders Need to Watch: Key Metrics

To make an informed decision, traders should keep these critical data points in mind:

  • Previous Close: $220.46

  • Friday’s Range: $219.06 (Low) to $221.60 (High)

  • Key Resistance: The daily high of $221.60. A break above this level could signal a continuation of the rally.

  • Key Support: The daily low of $219.06. A break below this could indicate further weakness.

  • P/E Ratio: 35.87. This indicates a more conventional valuation compared to some tech peers, which might appeal to value-conscious investors.

  • 52-Week Range: $151.61 – $242.52. The current price is firmly in the upper half of its yearly range, suggesting a solid long-term uptrend.

Is It the Right Time to Invest?

The data presents a nuanced scenario. The weak close on Friday is a point of caution, showing that sellers are active. However, the positive pre-market data provides a compelling reason for optimism.

A prudent strategy for Monday would be to watch the opening price action.

  • Bullish Scenario: If Amazon stock opens above the pre-market high and decisively breaks through Friday’s high of $221.60, it could be a strong signal to enter a long position.

  • Bearish Scenario: If the stock fails to hold its pre-market gains and falls below Friday’s low of $219.06, it would suggest the selling pressure from Friday is continuing.

In summary, the immediate outlook for Amazon stock is one of cautious optimism. The pre-market gains offer hope for a rebound, but traders should wait for confirmation at the market open before committing to a position.

Disclaimer: This article is for informational purposes only and is based on the analysis of the provided image. It should not be considered financial advice. All investors should conduct their own research and consult with a financial professional before making any investment decisions.

Back to top button
close