Navigating the Dip: Procter & Gamble’s Stock Declines, Presenting a Critical Moment for Shareholders

NEW YORK – Shares of the consumer goods titan Procter & Gamble (NYSE: PG) experienced notable selling pressure in a recent trading session, closing down as investors weighed a complex mix of market sentiment and forward-looking economic indicators. The blue-chip stalwart, a cornerstone of countless investment portfolios, finished the day at
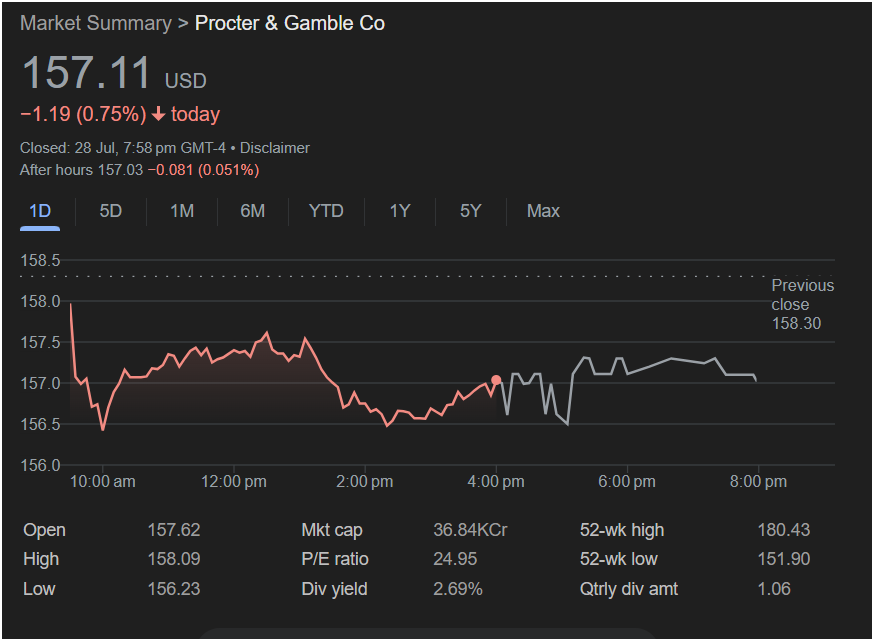
1.19, or 0.75%.
The drop, while modest in percentage terms for a mega-cap company, captures a moment of investor introspection. As the closing bell rang on July 28, the after-hours market saw a further slight dip, with the stock trading at $157.03, suggesting that bearish sentiment could linger. This detailed analysis will dissect the day’s trading activity, delve into the fundamental metrics that define P&G’s value proposition, explore the broader context driving the stock’s movement, and frame the critical questions facing investors now.
A Play-by-Play of the Trading Day: Decoding the Intraday Action
A single day on the stock market is a story told in numbers, and for Procter & Gamble, the narrative was one of early pressure and a hard-fought battle for stability. The provided intraday chart offers a granular look at the ebb and flow of investor sentiment from the opening bell to the close.
The Bearish Opening Gap:
The trading day began not with a bang, but with a palpable sense of caution. P&G stock opened at $157.62. This figure is critically important because it was significantly below the previous day’s close of $158.30. In market parlance, this is known as a “gap down,” an event that occurs when overnight or pre-market news and sentiment are negative, leading to an opening price lower than the prior session’s low point. This immediately set a negative tone, indicating that sellers were in control from the outset.
The Morning Plunge to the Day’s Low:
Following the weak open, the selling pressure intensified. The stock quickly descended, hitting its nadir for the session at $156.23. This sharp morning drop often reflects institutional trading activity, where large funds may be trimming positions, or automated trading algorithms reacting to the negative momentum. For retail investors watching the tape, this was a moment of concern, pushing the stock closer to its 52-week low than it has been in some time.
A Mid-day Battle for Support:
From approximately 10:00 AM through the early afternoon, a floor began to form. The chart shows the stock recovering from its lows and entering a period of choppy, sideways trading, oscillating primarily between $156.50 and $157.50. This phase represents a classic tug-of-war. On one side, buyers—perhaps value investors or those confident in P&G’s long-term prospects—stepped in, seeing the lower price as an attractive entry point. On the other side, sellers continued to exert pressure, preventing any significant rally. This period of consolidation is crucial; it shows that despite the negative open, there was enough demand to prevent a complete price collapse.
Afternoon Volatility and a Weak Close:
The latter half of the trading session, from 4:00 PM onwards, saw a pickup in volatility. The line chart becomes more jagged, indicating larger and more frequent price swings as the closing bell approached. The stock ultimately failed to reclaim the ground it had lost, closing at
158.09 was reached early on but was never seriously challenged again, reinforcing the dominance of negative sentiment throughout the session.
The Numbers Behind the Narrative: A Deep Dive into P&G’s Financial DNA
To truly understand P&G’s stock performance, one must look beyond a single day’s price chart and examine the fundamental metrics that underpin its valuation and investment thesis. These numbers provide the long-term context against which short-term fluctuations should be measured.
Market Capitalization: A True Titan of Industry
The image displays a market capitalization of “36.84KCr,” which appears to be a regional display format. The reality is that Procter & Gamble is one of the largest companies in the world, with a market capitalization consistently in the range of $370 billion USD. This places it firmly in the “mega-cap” category.
-
What this means: A mega-cap valuation signifies immense stability, deep market penetration, and a formidable competitive position. Companies of this size are less prone to the wild swings seen in smaller stocks. They are bellwethers for their sector and the economy at large. For investors, this size implies a degree of safety and predictability, even on a down day.
P/E Ratio: A Measure of Market Expectation
The stock’s Price-to-Earnings (P/E) ratio is listed at 24.95. This metric, calculated by dividing the stock price by the company’s annual earnings per share, is a primary tool for assessing valuation.
-
Is it high or low? A P/E of nearly 25 is neither excessively cheap nor outrageously expensive for a company like P&G. The broader S&P 500 often trades in a similar range. For the consumer staples sector, which is known for stable but slower growth, this valuation suggests that investors are willing to pay a premium for P&G’s reliability, brand strength, and consistent profitability. It reflects a market that expects P&G to continue delivering steady, predictable earnings for years to come.
The 52-Week Range: Contextualizing the Current Price
The stock’s current price of
151.90 (low)** to $180.43 (high).
-
What this tells us: At its current level, P&G is trading significantly off its highs and is drifting closer to its 52-week low. From a technical analysis perspective, the 52-week low of $151.90 represents a major psychological and technical support level. If the stock were to approach this price, a significant number of buyers might emerge. Conversely, the high of $180.43 acts as a ceiling, or resistance level, that the stock has failed to break through in the past year. The current price suggests the stock has lost its upward momentum and is in a period of consolidation or downtrend.
The Dividend: P&G’s Crown Jewel
Perhaps the most compelling part of P&G’s story for many investors is its dividend. The data shows:
-
Dividend Yield: 2.69%
-
Quarterly Dividend Amount: $1.06
This is far more than just a number; it is the bedrock of the P&G investment thesis.
-
The Power of the Yield: A yield of 2.69% is highly attractive in any market environment, providing a steady stream of income to shareholders regardless of the stock’s day-to-day fluctuations. For retirees and income-focused investors, this reliable cash flow is paramount.
-
The “Dividend King” Status: P&G is not just a dividend-paying company; it is a Dividend King. This prestigious title is reserved for companies that have increased their dividend for at least 50 consecutive years. P&G has an incredible track record of increasing its dividend for over 67 straight years. This remarkable consistency demonstrates a deep-seated commitment to returning capital to shareholders and an operational resilience that has weathered decades of economic cycles, wars, and pandemics. The recent increase to $1.06 per quarter continues this legendary streak, signaling management’s confidence in the company’s future cash flows.
The Broader Context: Why Did P&G Stumble?
A stock’s movement is rarely caused by a single factor. The 0.75% drop in P&G shares is likely the result of a confluence of forces—macroeconomic pressures, sector-wide trends, and company-specific anxieties.
1. The Macroeconomic Environment:
Procter & Gamble’s performance is intrinsically linked to the health of the global consumer.
-
Inflation and Consumer Spending: While inflation has shown signs of cooling in some areas, elevated prices for essentials like food, gas, and housing continue to squeeze household budgets. When consumers feel pinched, they may engage in “trade-down” behavior—switching from premium, branded products like Tide or Pampers to cheaper private-label or store-brand alternatives. This directly threatens P&G’s sales volumes.
-
Interest Rates: The specter of “higher for longer” interest rates from the Federal Reserve can negatively impact stocks in two ways. First, it makes borrowing more expensive for companies. Second, it makes lower-risk assets like bonds and high-yield savings accounts more attractive, potentially drawing money away from dividend stocks like P&G.
2. Pre-Earnings Jitters:
The date on the chart, July 28, is significant. P&G’s fiscal year ends on June 30, and the company typically reports its fourth-quarter and full-year earnings in late July or early August. The stock’s decline could very well be a reflection of pre-earnings anxiety. Investors and analysts may be positioning themselves for a report that could miss expectations or, more importantly, provide cautious guidance for the upcoming fiscal year. Key concerns would be whether P&G’s price hikes are starting to deter customers and whether sales volumes are holding up.
3. Sector-Wide Pressure:
It’s crucial to consider if P&G was falling alone or if the entire consumer staples sector was under pressure. Often, macroeconomic data or analyst reports on consumer spending can cause a ripple effect across all companies in the sector, including competitors like Kimberly-Clark (KMB), Colgate-Palmolive (CL), and Unilever (UL). A “risk-off” day in the market, where investors shed defensive names in favor of cash or other asset classes, could also explain the broad-based weakness.
The Enduring Strength: The Bull Case for Procter & Gamble
Despite a single day’s dip, the long-term investment case for P&G remains powerful and is built on several unshakeable pillars.
-
An Unrivaled Brand Portfolio: P&G’s strength begins with its portfolio of iconic, category-defining brands. Names like Tide, Charmin, Bounty, Pampers, Gillette, Crest, and Head & Shoulders are more than just products; they are cultural fixtures. This brand equity creates a powerful competitive “moat,” allowing P&G to command premium pricing and maintain market share.
-
Global Diversification: P&G is not just an American company; it is a global powerhouse with operations and sales in over 180 countries. This geographic diversification means that weakness in one region can be offset by strength in another, providing a buffer against localized economic downturns.
-
Innovation and R&D: P&G spends billions of dollars annually on research and development. This commitment to innovation ensures that its products remain best-in-class and that the company can adapt to changing consumer preferences, such as the growing demand for sustainable and eco-friendly products.
-
Operational Excellence and Supply Chain Mastery: A company of P&G’s scale requires an incredibly sophisticated and efficient supply chain. Its ability to manufacture, market, and distribute products on a massive global scale is a core competitive advantage that is nearly impossible for smaller rivals to replicate.
The Challenges Ahead: The Bear Case and Potential Headwinds
No investment is without risk, and investors considering P&G must also acknowledge the challenges it faces.
-
Intensifying Competition: The rise of agile, digitally native, direct-to-consumer (DTC) brands poses a threat to established giants. Furthermore, in an inflationary environment, the appeal of lower-cost private-label brands from retailers like Walmart, Costco, and Target becomes a significant headwind.
-
Valuation Questions: As previously mentioned, a P/E ratio in the mid-20s for a company with relatively mature growth prospects can be seen as rich by some investors. The bear case argues that the stock may be fully valued, leaving little room for upside without a significant acceleration in growth.
-
Foreign Exchange (Forex) Headwinds: As a global company, a strong U.S. dollar can negatively impact P&G’s financial results. When sales from international markets are converted back into a stronger dollar, they translate into fewer dollars, which can weigh on reported revenue and earnings growth.
As Procter & Gamble moves forward, the market will be intensely focused on its upcoming earnings report. Investors will be scrutinizing not just the headline revenue and earnings-per-share numbers, but also the underlying volume trends, profit margins, and, most critically, the company’s financial guidance for the year ahead. The story of this single day’s decline is but one chapter in the ongoing saga of a corporate giant navigating a complex and ever-changing world. The next chapter is about to be written.
