
For traders closely watching Meta Platforms Inc. (NASDAQ: META), the latest data presents a complex but potentially opportunistic picture. While the stock closed slightly down in the previous session, strong pre-market activity suggests a bullish open for today’s trading. This article breaks down all the critical information from the chart to help you decide if investing in Meta stock today is the right move for your strategy.
A Look at the Last Trading Session
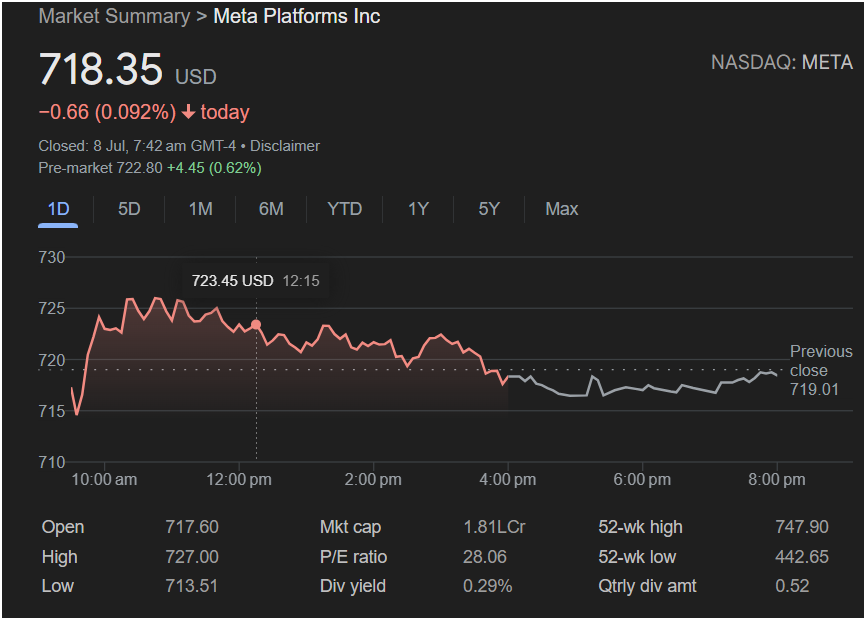
Based on the 1D chart from July 8th, Meta stock experienced significant intraday volatility. Here’s a summary of the session’s key data points:
-
Closing Price: 718.35 USD
-
Day’s Change: -0.66 (-0.092%)
-
Open: 717.60
-
Day’s High: 727.00
-
Day’s Low: 713.51
-
Previous Close: 719.01
The stock opened and quickly rallied in the morning, hitting a peak of $727.00. However, after reaching this high around noon, it faced selling pressure and trended downward for the remainder of the afternoon, ultimately closing just below its opening price and the previous day’s close. This pattern indicates that while there was early buying enthusiasm, sellers took control in the latter half of the day.
Pre-Market Action: A Sign of Renewed Momentum?
The most crucial piece of information for today is the pre-market performance. As of the time of the image, Meta stock is trading at 722.80 USD, which is an increase of +4.45 (0.62%).
This pre-market gap-up is significant because it erases the previous day’s losses and positions the stock to open near the midday high of the last session. This indicates positive sentiment or news may be influencing investors before the market opens.
Key Financials and Metrics a Trader Needs
To get a complete picture, let’s look at the other essential data provided:
-
Market Cap: 1.81L Cr (A very large market capitalization, indicating it is a stable, blue-chip company).
-
P/E Ratio: 28.06 (This is a moderate valuation for a major tech company, suggesting the price is not excessively inflated relative to its earnings).
-
52-Week High: 747.90
-
52-Week Low: 442.65 (The current price is much closer to its 52-week high, indicating a strong uptrend over the past year).
-
Dividend Yield: 0.29% (While small, the presence of a dividend can attract long-term, income-focused investors).
-
Quarterly Dividend Amount: 0.52
Should You Invest in Meta Stock Today? Key Levels to Watch
Deciding whether to invest depends on your trading style and risk tolerance. Here is a breakdown based on the data:
For Day Traders:
The pre-market rally presents a clear opportunity. The key battleground will be the previous day’s high of $727.00.
-
Bullish Scenario: If the stock opens strong and breaks decisively above $727.00, it could signal a continuation of the rally towards the 52-week high of $747.90.
-
Bearish Scenario: Traders should watch for a “gap fill.” This occurs if the stock fails to hold its opening gains and falls back to fill the price gap down to the previous day’s close of $718.35. This could be a shorting opportunity.
For Swing Traders (Short to Medium Term):
The chart shows that the
727 range has acted as resistance. A sustained move above this level is critical for the next leg up. The support level to watch is the previous day’s low of $713.51. A break below this could indicate that the bullish momentum has faded.
For Long-Term Investors:
One day’s volatility is less of a concern. The fact that Meta is a large-cap company, trading near its 52-week high, with a reasonable P/E ratio and a dividend, points to fundamental strength. For a long-term investor, the current price could represent a reasonable entry point, especially if they believe in the company’s future growth prospects.
Meta stock is poised for an active trading day. The strong pre-market performance signals bullish intent, but it will face a key test at the
718.35 or lower. Traders should monitor the opening price action carefully and have a clear strategy based on these key levels.
Disclaimer: This article is for informational purposes only and is based on the analysis of the provided image. It does not constitute financial advice. All investing involves risk, and you should conduct your own research or consult with a qualified financial advisor before making any investment decisions.


