
JPMorgan Chase & Co. (JPM) stock is facing significant downward pressure, leaving investors and traders to question what the next trading session holds. After closing on July 8th with a notable loss, the preliminary data points to continued bearish sentiment ahead of the market open on Monday. This analysis breaks down the key figures for traders watching JPM.
On its last trading day, JPMorgan stock closed at
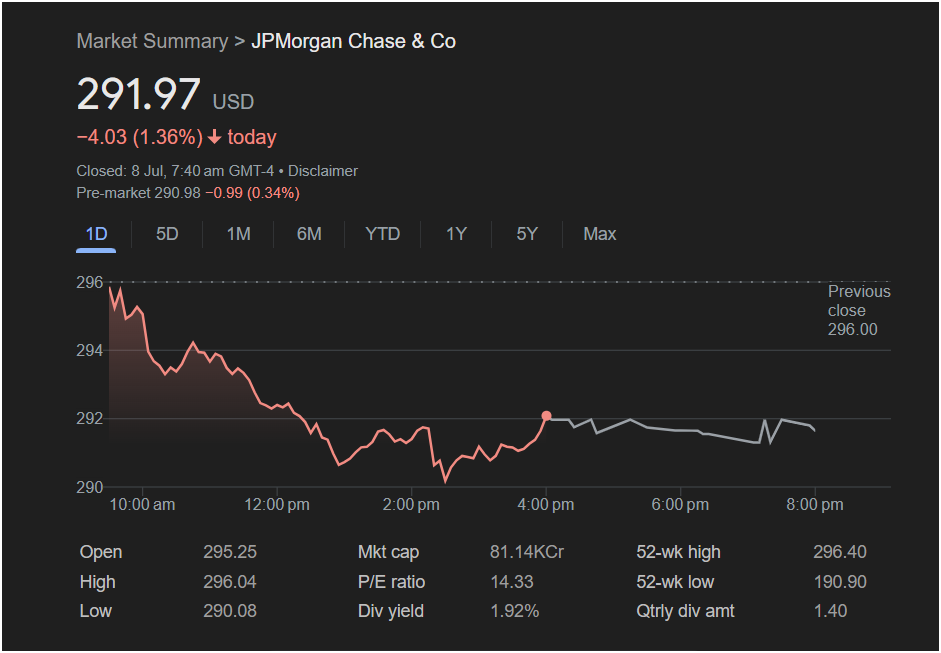
4.03 (1.36%). The intraday chart reveals a consistent selling trend, with the stock opening at $295.25 and failing to find solid footing throughout the session, ultimately hitting a low of $290.08.
For traders preparing for Monday, here is a detailed breakdown of the critical information from the market summary:
The Bearish Case: Momentum Points Down
The most immediate concern for bulls is the negative momentum carrying over. Not only did the stock close weak, but pre-market data shows a further decline to $290.98, down another 0.34%. This pre-market price is hovering dangerously close to the previous day’s low of $290.08.
-
Key Support Level: The price of $290.08 is now the critical support level to watch. A break below this point at the market open on Monday could trigger further selling as it would establish a new low.
-
Failed Resistance: The stock briefly touched a high of
296.40), before being rejected. This level, along with the previous close of $296.00, now acts as a strong resistance ceiling. Any attempt at a recovery will need to decisively break through this zone.
The Broader Context: A Pullback from the Top?
While the one-day trend is clearly negative, long-term investors might see a different picture. The fact that the stock was trading near its 52-week high suggests the recent drop could be a result of profit-taking after a strong run-up, rather than a fundamental shift in the company’s outlook. The stock is still significantly above its 52-week low of $190.90.
Key financial metrics provide additional context:
-
P/E Ratio: 14.33
-
Dividend Yield: 1.92%
-
Market Cap: 81.14KCr
These figures represent a stable, blue-chip company that may appeal to investors looking for value after a dip.
Outlook for Today (Monday): A Trader’s Perspective
Based on the available data, the immediate sentiment for JPMorgan stock is bearish. The combination of a sharp sell-off and negative pre-market activity suggests sellers are currently in control.
The critical question for today is whether the $290 support level will hold.
-
If it breaks: Expect potential continuation of the downward trend.
-
If it holds: Buyers may step in, seeing a potential discount. A bounce would need to reclaim the
293 range to show signs of stabilization.
Is it right to invest today? That depends entirely on your strategy. Short-term traders will be watching the support and resistance levels for volatility plays. Long-term investors, however, might view this pullback as a potential buying opportunity in a market leader, provided their own research supports a positive long-term thesis for JPMorgan Chase & Co.
Disclaimer: This article is an analysis of past market data and should not be considered financial advice. Market conditions are subject to change, and all investors should conduct their own thorough research before making any investment decisions.


