
New York, NY – Meta Platforms Inc. (NASDAQ: META) stock closed a volatile session on Monday, July 1st, finishing in positive territory but leaving traders with a mixed set of signals for the week ahead. While the technology giant demonstrated significant underlying strength by hitting a new 52-week high, a late-day fade from its peak suggests potential resistance. This article breaks down Monday’s action to help you understand what might be next for Meta’s stock.
Monday’s Market Recap: A Tale of Two Halves
Meta’s stock ended the trading day at
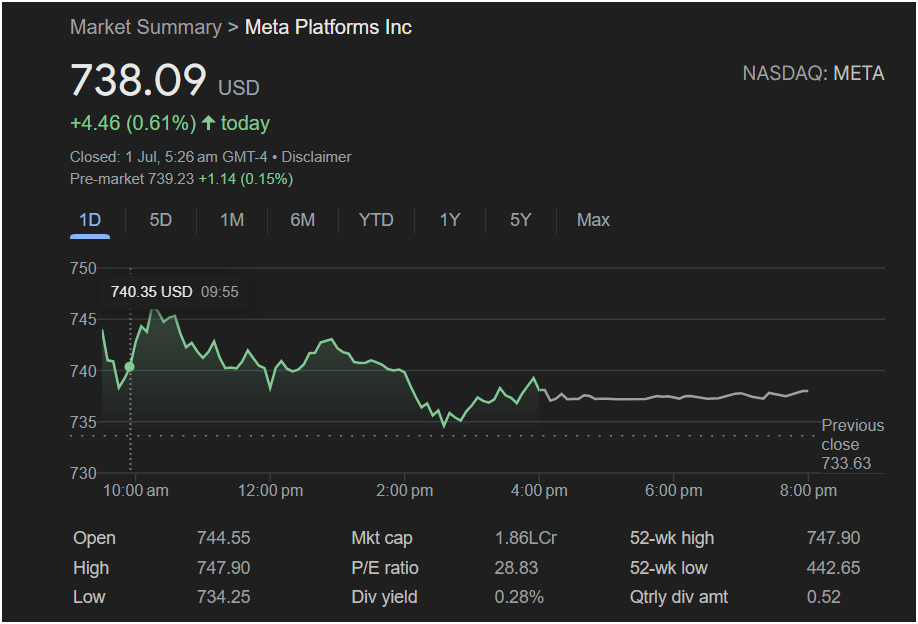
4.46 (+0.61%). The positive close was underscored by promising pre-market activity for Tuesday, which saw the stock up an additional $1.14 (+0.15%) to $739.23.
The most bullish signal from the session was the stock’s powerful morning surge. Shortly after the market opened, META soared to a new 52-week high of $747.90. This indicates strong investor confidence and powerful upward momentum in the stock’s broader trend.
However, after hitting that peak around 10:00 AM, the stock spent most of the day in a downtrend. It fell to a low of $734.25 before staging a modest recovery into the close. This pullback from the high suggests that some investors took profits at the new peak, creating a resistance level that traders will be watching closely.
Key Trading Data at a Glance
For any trader evaluating an entry or exit, these are the critical numbers from Monday’s session:
-
Previous Close: $733.63
-
Open: $744.55
-
Day’s High: $747.90
-
Day’s Low: $734.25
-
Closing Price: $738.09
-
52-Week Range: $442.65 – $747.90
-
Market Cap: 1.86L Cr (approximately $1.86 Trillion)
-
P/E Ratio: 28.83
-
Dividend Yield: 0.28%
Analysis: Will the Stock Go Up or Down on Tuesday?
The outlook for Meta stock on the next trading day is cautiously optimistic.
The Bullish Case (Why it might go up):
The primary driver for optimism is the achievement of a new 52-week high. This is a psychologically important milestone that confirms a strong uptrend. Furthermore, the positive pre-market trading suggests that buying interest has carried over and could lead to a higher open on Tuesday.
The Bearish Case (Why it might go down):
The significant fade from the high of $747.90 to the close of $738.09 is a red flag. It shows that sellers stepped in at that level. If the stock is unable to break through this new resistance point, it could consolidate or pull back further to test the day’s low of around $734.
Is It Right to Invest Today?
For a long-term investor, the stock’s ability to consistently hit new highs is a positive sign of a healthy, growing company. The P/E ratio of 28.83 is not excessively high for a tech leader, and the recently initiated dividend provides a small but steady return.
For a short-term trader, Tuesday’s session will be critical. The key levels to watch are:
-
Resistance: The 52-week high of $747.90. A sustained break above this level could trigger another leg up.
-
Support: The day’s low of $734.25. A drop below this could signal that the pullback has more room to run.
Investing in Meta today comes down to your strategy and risk tolerance. The stock is in a clear uptrend but is facing immediate resistance after a strong run. A conservative trader might wait to see if the stock can decisively break its new high, while a more aggressive trader might see the pre-market strength as a buying opportunity. Watch the opening price action carefully to gauge market sentiment for the day.


